<< Chapter < Page Chapter >> Page >
Marginal revenue, marginal cost, marginal and total profit
Quantity Marginal Revenue Marginal Cost Marginal Profit Total Profit
1 1,200 1,500 –300 –300
2 1,000 300 700 400
3 800 400 400 800
4 600 600 0 800
5 400 700 –300 500
6 200 700 –500 0
7 0 1,400 –1,400 –1,400

[link] repeats the marginal cost and marginal revenue data from [link] , and adds two more columns: Marginal profit is the profitability of each additional unit sold. It is defined as marginal revenue minus marginal cost. Finally, total profit is the sum of marginal profits. As long as marginal profit is positive, producing more output will increase total profits. When marginal profit turns negative, producing more output will decrease total profits. Total profit is maximized where marginal revenue equals marginal cost. In this example, maximum profit occurs at 4 units of output.

A perfectly competitive firm will also find its profit-maximizing level of output where MR = MC. The key difference with a perfectly competitive firm is that in the case of perfect competition, marginal revenue is equal to price (MR = P), while for a monopolist, marginal revenue is not equal to the price, because changes in quantity of output affect the price.

Illustrating monopoly profits

It is straightforward to calculate profits of given numbers for total revenue and total cost. However, the size of monopoly profits can also be illustrated graphically with [link] , which takes the marginal cost and marginal revenue curves from the previous exhibit and adds an average cost curve and the monopolist’s perceived demand curve.

Illustrating profits at the healthpill monopoly

The graph shows revenues and profits for the monopolist at the profit maximizing level of output.
This figure begins with the same marginal revenue and marginal cost curves from the HealthPill monopoly presented in [link] . It then adds an average cost curve and the demand curve faced by the monopolist. The HealthPill firm first chooses the quantity where MR = MC; in this example, the quantity is 4. The monopolist then decides what price to charge by looking at the demand curve it faces. The large box, with quantity on the horizontal axis and marginal revenue on the vertical axis, shows total revenue for the firm. Total costs for the firm are shown by the lighter-shaded box, which is quantity on the horizontal axis and marginal cost of production on the vertical axis. The large total revenue box minus the smaller total cost box leaves the darkly shaded box that shows total profits. Since the price charged is above average cost, the firm is earning positive profits.

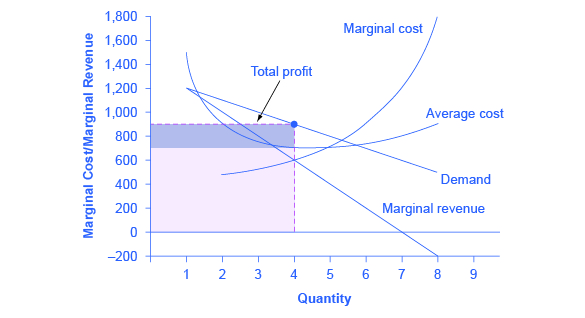
[link] illustrates the three-step process where a monopolist: selects the profit-maximizing quantity to produce; decides what price to charge; determines total revenue, total cost, and profit.

Step 1: The Monopolist Determines Its Profit-Maximizing Level of Output

The firm can use the points on the demand curve D to calculate total revenue, and then, based on total revenue, calculate its marginal revenue curve. The profit-maximizing quantity will occur where MR = MC—or at the last possible point before marginal costs start exceeding marginal revenue. On [link] , MR = MC occurs at an output of 4.

Questions & Answers

calculate molarity of NaOH solution when 25.0ml of NaOH titrated with 27.2ml of 0.2m H2SO4
Gasin Reply
what's Thermochemistry
rhoda Reply
the study of the heat energy which is associated with chemical reactions
Kaddija
How was CH4 and o2 was able to produce (Co2)and (H2o
Edafe Reply
explain please
Victory
First twenty elements with their valences
Martine Reply
what is chemistry
asue Reply
what is atom
asue
what is the best way to define periodic table for jamb
Damilola Reply
what is the change of matter from one state to another
Elijah Reply
what is isolation of organic compounds
IKyernum Reply
what is atomic radius
ThankGod Reply
Read Chapter 6, section 5
Dr
Read Chapter 6, section 5
Kareem
Atomic radius is the radius of the atom and is also called the orbital radius
Kareem
atomic radius is the distance between the nucleus of an atom and its valence shell
Amos
Read Chapter 6, section 5
paulino
Bohr's model of the theory atom
Ayom Reply
is there a question?
Dr
when a gas is compressed why it becomes hot?
ATOMIC
It has no oxygen then
Goldyei
read the chapter on thermochemistry...the sections on "PV" work and the First Law of Thermodynamics should help..
Dr
Which element react with water
Mukthar Reply
Mgo
Ibeh
an increase in the pressure of a gas results in the decrease of its
Valentina Reply
definition of the periodic table
Cosmos Reply
What is the lkenes
Da Reply
what were atoms composed of?
Moses Reply
Got questions? Join the online conversation and get instant answers!
Jobilize.com Reply

Get Jobilize Job Search Mobile App in your pocket Now!

Get it on Google Play Download on the App Store Now


Source:  OpenStax, Microeconomics. OpenStax CNX. Aug 03, 2014 Download for free at http://legacy.cnx.org/content/col11627/1.10
Google Play and the Google Play logo are trademarks of Google Inc.

Notification Switch

Would you like to follow the 'Microeconomics' conversation and receive update notifications?

Ask