<< Chapter < Page Chapter >> Page >

The highest achievable indifference curve touches the opportunity set at a single point of tangency. Since an infinite number of indifference curves exist, even if only a few of them are drawn on any given diagram, there will always exist one indifference curve that touches the budget line at a single point of tangency. All higher indifference curves, like Uh, will be completely above the budget line and, although the choices on that indifference curve would provide higher utility, they are not affordable given the budget set. All lower indifference curves, like Ul, will cross the budget line in two separate places. When one indifference curve crosses the budget line in two places, however, there will be another, higher, attainable indifference curve sitting above it that touches the budget line at only one point of tangency.

Changes in income

A rise in income causes the budget constraint to shift to the right. In graphical terms, the new budget constraint will now be tangent to a higher indifference curve, representing a higher level of utility. A reduction in income will cause the budget constraint to shift to the left, which will cause it to be tangent to a lower indifference curve, representing a reduced level of utility. If income rises by, for example, 50%, exactly how much will a person alter consumption of books and doughnuts? Will consumption of both goods rise by 50%? Or will the quantity of one good rise substantially, while the quantity of the other good rises only a little, or even declines?

Since personal preferences and the shape of indifference curves are different for each individual, the response to changes in income will be different, too. For example, consider the preferences of Manuel and Natasha in [link] (a) and [link] (b). They each start with an identical income of $40, which they spend on yogurts that cost $1 and rental movies that cost $4. Thus, they face identical budget constraints. However, based on Manuel’s preferences, as revealed by his indifference curves, his utility-maximizing choice on the original budget set occurs where his opportunity set is tangent to the highest possible indifference curve at W, with three movies and 28 yogurts, while Natasha’s utility-maximizing choice on the original budget set at Y will be seven movies and 12 yogurts.

Manuel and natasha’s indifference curves

Both images in the graph show “rental movies” on the x-axis and “yogurts” on the y-axis. Image (a) shows Manuel’s reaction to more income with. From the two indifference curves, points W (3, 28) and X (7,32) are marked. Image (b) shows Natasha’s reaction to more income. From the two indifference curves, points Y (7, 12) and Z (8, 28) are marked.
Manuel and Natasha originally face the same budget constraints; that is, same prices and same income. However, the indifference curves that illustrate their preferences are not the same. (a) Manuel’s original choice at W involves more yogurt and more movies, and he reacts to the higher income by mainly increasing consumption of movies at X. (b) Conversely, Natasha’s original choice (Y) involves relatively more movies, but she reacts to the higher income by choosing relatively more yogurts. Even when budget constraints are the same, personal preferences lead to different original choices and to different reactions in response to a change in income.

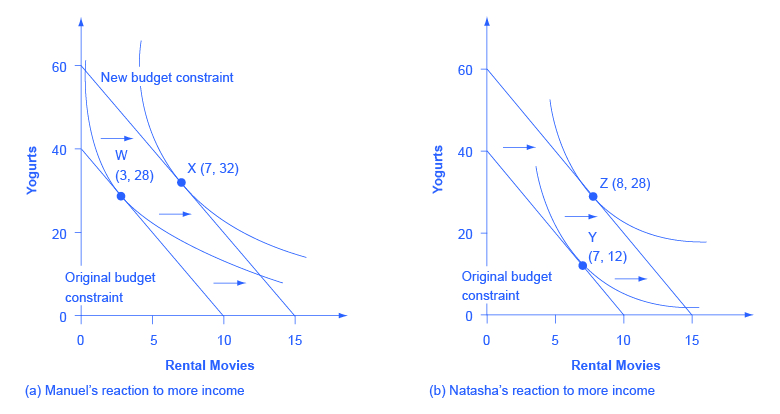
Now, say that income rises to $60 for both Manuel and Natasha, so their budget constraints shift to the right. As shown in [link] (a), Manuel’s new utility maximizing choice at X will be seven movies and 32 yogurts—that is, Manuel will choose to spend most of the extra income on movies. Natasha’s new utility maximizing choice at Z will be eight movies and 28 yogurts—that is, she will choose to spend most of the extra income on yogurt. In this way, the indifference curve approach allows for a range of possible responses. However, if both goods are normal goods, then the typical response to a higher level of income will be to purchase more of them—although exactly how much more is a matter of personal preference. If one of the goods is an inferior good, the response to a higher level of income will be to purchase less of it.

Questions & Answers

Ayele, K., 2003. Introductory Economics, 3rd ed., Addis Ababa.
Widad Reply
can you send the book attached ?
Ariel
?
Ariel
What is economics
Widad Reply
the study of how humans make choices under conditions of scarcity
AI-Robot
U(x,y) = (x×y)1/2 find mu of x for y
Desalegn Reply
U(x,y) = (x×y)1/2 find mu of x for y
Desalegn
what is ecnomics
Jan Reply
this is the study of how the society manages it's scarce resources
Belonwu
what is macroeconomic
John Reply
macroeconomic is the branch of economics which studies actions, scale, activities and behaviour of the aggregate economy as a whole.
husaini
etc
husaini
difference between firm and industry
husaini Reply
what's the difference between a firm and an industry
Abdul
firm is the unit which transform inputs to output where as industry contain combination of firms with similar production 😅😅
Abdulraufu
Suppose the demand function that a firm faces shifted from Qd  120 3P to Qd  90  3P and the supply function has shifted from QS  20  2P to QS 10  2P . a) Find the effect of this change on price and quantity. b) Which of the changes in demand and supply is higher?
Toofiq Reply
explain standard reason why economic is a science
innocent Reply
factors influencing supply
Petrus Reply
what is economic.
Milan Reply
scares means__________________ends resources. unlimited
Jan
economics is a science that studies human behaviour as a relationship b/w ends and scares means which have alternative uses
Jan
calculate the profit maximizing for demand and supply
Zarshad Reply
Why qualify 28 supplies
Milan
what are explicit costs
Nomsa Reply
out-of-pocket costs for a firm, for example, payments for wages and salaries, rent, or materials
AI-Robot
concepts of supply in microeconomics
David Reply
economic overview notes
Amahle Reply
identify a demand and a supply curve
Salome Reply
i don't know
Parul
there's a difference
Aryan
Demand curve shows that how supply and others conditions affect on demand of a particular thing and what percent demand increase whith increase of supply of goods
Israr
Hi Sir please how do u calculate Cross elastic demand and income elastic demand?
Abari

Get Jobilize Job Search Mobile App in your pocket Now!

Get it on Google Play Download on the App Store Now


Source:  OpenStax, Microeconomics. OpenStax CNX. Aug 03, 2014 Download for free at http://legacy.cnx.org/content/col11627/1.10
Google Play and the Google Play logo are trademarks of Google Inc.

Notification Switch

Would you like to follow the 'Microeconomics' conversation and receive update notifications?

Ask