<< Chapter < Page Chapter >> Page >

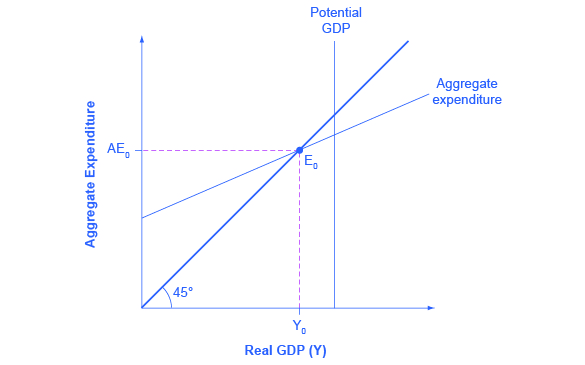
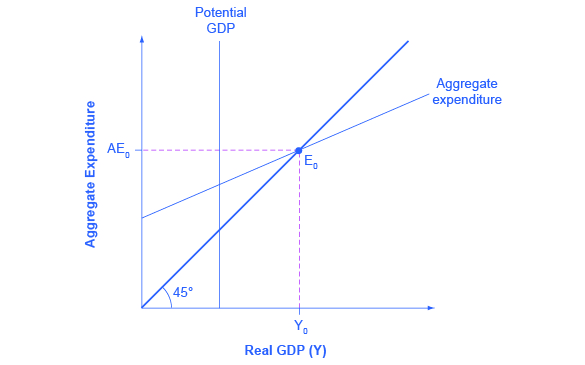
In a Keynesian cross diagram, the equilibrium may be at a level below potential GDP, which is called a recessionary gap, or at a level above potential GDP, which is called an inflationary gap.

The multiplier effect describes how an initial change in aggregate demand generated several times as much as cumulative GDP. The size of the spending multiplier is determined by three leakages: spending on savings, taxes, and imports. The formula for the multiplier is:

Multiplier  =  1 1 – (MPC × (1 – tax rate) + MPI)

An economy with a lower multiplier is more stable—it is less affected either by economic events or by government policy than an economy with a higher multiplier.

Self-check questions

Sketch the aggregate expenditure-output diagram with the recessionary gap.

Got questions? Get instant answers now!

Solution

The following figure shows the aggregate expenditure-output diagram with the recessionary gap.
The graph shows the aggregate expenditure-output diagram with a recessionary gap.

Sketch the aggregate expenditure-output diagram with an inflationary gap.

Got questions? Get instant answers now!

Solution

The following figure shows the aggregate expenditure-output diagram with an inflationary gap.
The graph shows the aggregate expenditure-output diagram with an inflationary gap. The potential GDP line appears to the left of the equilibrium point.

An economy has the following characteristics:

Y = National income

Taxes = T = 0.25Y

C = Consumption = 400 + 0.85(Y – T)

I = 300

G = 200

X = 500

M = 0.1(Y – T)

Find the equilibrium for this economy. If potential GDP is 3,500, then what change in government spending is needed to achieve this level? Do this problem two ways. First, plug 3,500 into the equations and solve for G. Second, calculate the multiplier and figure it out that way.

Got questions? Get instant answers now!

Solution

First, set up the calculation.

AE  =  400 + 0.85(Y – T) + 300 + 200 + 500 – 0.1(Y – T) AE  =  Y

Then insert Y for AE and 0.25Y for T.

Y  =  400 + 0.85(Y – 0.25Y) + 300 + 200 + 500 – 0.1(Y – 0.25Y) Y  =  1400 + 0.6375Y – 0.075Y 0.4375Y  =  1400 Y  =  3200

If full employment is 3,500, then one approach is to plug in 3,500 for Y throughout the equation, but to leave G as a separate variable.

Y  =  400 + 0.85(Y – 0.25Y) + 300 + G + 500 + 0.1(Y – 0.25Y) 3500  =  400 + 0.85(3500 – 0.25(3500)) + 300 + G + 500 – 0.1(3500 – 0.25(3500)) G  =  3500 – 400 – 2231.25 – 1300 – 500 + 262.5 G  =  331.25

A G value of 331.25 is an increase of 131.25 from its original level of 200.

Alternatively, the multiplier is that, out of every dollar spent, 0.25 goes to taxes, leaving 0.75, and out of after-tax income, 0.15 goes to savings and 0.1 to imports. Because (0.75)(0.15) = 0.1125 and (0.75)(0.1) = 0.075, this means that out of every dollar spent: 1 –0.25 –0.1125 –0.075 = 0.5625.

Thus, using the formula, the multiplier is:

1 1 – 0.5625  =  2.2837

To increase equilibrium GDP by 300, it will take a boost of 300/2.2837, which again works out to 131.25.

[link] represents the data behind a Keynesian cross diagram. Assume that the tax rate is 0.4 of national income; the MPC out of the after-tax income is 0.8; investment is $2,000; government spending is $1,000; exports are $2,000 and imports are 0.05 of after-tax income. What is the equilibrium level of output for this economy?

National Income After-tax Income Consumption I + G + X Minus Imports Aggregate Expenditures
$8,000 $4,340
$9,000
$10,000
$11,000
$12,000
$13,000

Got questions? Get instant answers now!

Questions & Answers

how do you get the 2/50
Abba Reply
number of sport play by 50 student construct discrete data
Aminu Reply
width of the frangebany leaves on how to write a introduction
Theresa Reply
Solve the mean of variance
Veronica Reply
Step 1: Find the mean. To find the mean, add up all the scores, then divide them by the number of scores. ... Step 2: Find each score's deviation from the mean. ... Step 3: Square each deviation from the mean. ... Step 4: Find the sum of squares. ... Step 5: Divide the sum of squares by n – 1 or N.
kenneth
what is error
Yakuba Reply
Is mistake done to something
Vutshila
Hy
anas
hy
What is the life teble
anas
hy
Jibrin
statistics is the analyzing of data
Tajudeen Reply
what is statics?
Zelalem Reply
how do you calculate mean
Gloria Reply
diveving the sum if all values
Shaynaynay
let A1,A2 and A3 events be independent,show that (A1)^c, (A2)^c and (A3)^c are independent?
Fisaye Reply
what is statistics
Akhisani Reply
data collected all over the world
Shaynaynay
construct a less than and more than table
Imad Reply
The sample of 16 students is taken. The average age in the sample was 22 years with astandard deviation of 6 years. Construct a 95% confidence interval for the age of the population.
Aschalew Reply
Bhartdarshan' is an internet-based travel agency wherein customer can see videos of the cities they plant to visit. The number of hits daily is a normally distributed random variable with a mean of 10,000 and a standard deviation of 2,400 a. what is the probability of getting more than 12,000 hits? b. what is the probability of getting fewer than 9,000 hits?
Akshay Reply
Bhartdarshan'is an internet-based travel agency wherein customer can see videos of the cities they plan to visit. The number of hits daily is a normally distributed random variable with a mean of 10,000 and a standard deviation of 2,400. a. What is the probability of getting more than 12,000 hits
Akshay
1
Bright
Sorry i want to learn more about this question
Bright
Someone help
Bright
a= 0.20233 b=0.3384
Sufiyan
a
Shaynaynay
How do I interpret level of significance?
Mohd Reply
It depends on your business problem or in Machine Learning you could use ROC- AUC cruve to decide the threshold value
Shivam
how skewness and kurtosis are used in statistics
Owen Reply
yes what is it
Taneeya
Got questions? Join the online conversation and get instant answers!
Jobilize.com Reply

Get Jobilize Job Search Mobile App in your pocket Now!

Get it on Google Play Download on the App Store Now


Source:  OpenStax, Macroeconomics. OpenStax CNX. Jun 16, 2014 Download for free at http://legacy.cnx.org/content/col11626/1.10
Google Play and the Google Play logo are trademarks of Google Inc.

Notification Switch

Would you like to follow the 'Macroeconomics' conversation and receive update notifications?

Ask