

| << Chapter < Page | Chapter >> Page > |
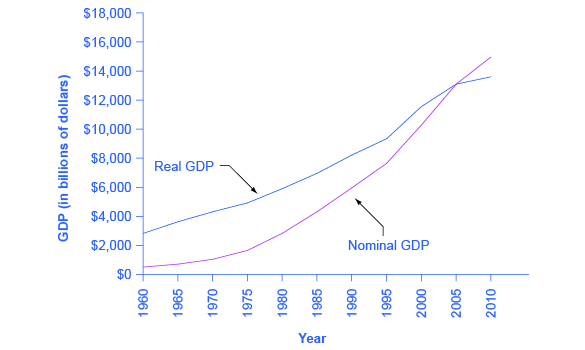
[link] shows the U.S. nominal and real GDP since 1960. Because 2005 is the base year, the nominal and real values are exactly the same in that year. However, over time, the rise in nominal GDP looks much larger than the rise in real GDP (that is, the nominal GDP line rises more steeply than the real GDP line), because the rise in nominal GDP is exaggerated by the presence of inflation, especially in the 1970s.
Let’s return to the question posed originally: How much did GDP increase in real terms? What was the rate of growth of real GDP from 1960 to 2010? To find the real growth rate, we apply the formula for percentage change:
In other words, the U.S. economy has increased real production of goods and services by nearly a factor of four since 1960. Of course, that understates the material improvement since it fails to capture improvements in the quality of products and the invention of new products.
There is a quicker way to answer this question approximately, using another math trick. Because:
Therefore, the growth rate of real GDP (% change in quantity) equals the growth rate in nominal GDP (% change in value) minus the inflation rate (% change in price).
Note that using this equation provides an approximation for small changes in the levels. For more accurate measures, one should use the first formula shown.
The nominal value of an economic statistic is the commonly announced value. The real value is the value after adjusting for changes in inflation. To convert nominal economic data from several different years into real, inflation-adjusted data, the starting point is to choose a base year arbitrarily and then use a price index to convert the measurements so that they are measured in the money prevailing in the base year.
The “prime” interest rate is the rate that banks charge their best customers. Based on the nominal interest rates and inflation rates given in [link] , in which of the years given would it have been best to be a lender? Based on the nominal interest rates and inflation rates given in [link] , in which of the years given would it have been best to be a borrower?
| Year | Prime Interest Rate | Inflation Rate |
|---|---|---|
| 1970 | 7.9% | 5.7% |
| 1974 | 10.8% | 11.0% |
| 1978 | 9.1% | 7.6% |
| 1981 | 18.9% | 10.3% |
A mortgage loan is a loan that a person makes to purchase a house. [link] provides a list of the mortgage interest rate being charged for several different years and the rate of inflation for each of those years. In which years would it have been better to be a person borrowing money from a bank to buy a home? In which years would it have been better to be a bank lending money?
| Year | Mortgage Interest Rate | Inflation Rate |
|---|---|---|
| 1984 | 12.4% | 4.3% |
| 1990 | 10% | 5.4% |
| 2001 | 7.0% | 2.8% |
Notification Switch
Would you like to follow the 'Macroeconomics' conversation and receive update notifications?

|
|

|
|

|
|

|
|

|
|

|
|

|
|

|
|

|
|

|
|

|