<< Chapter < Page Chapter >> Page >

A world of money

This is a picture of many different currencies from around the world.
We are all part of the global financial system, which includes many different currencies. (Credit: modification of work by epSos.de/Flickr Creative Commons)

More than meets the eye in the congo

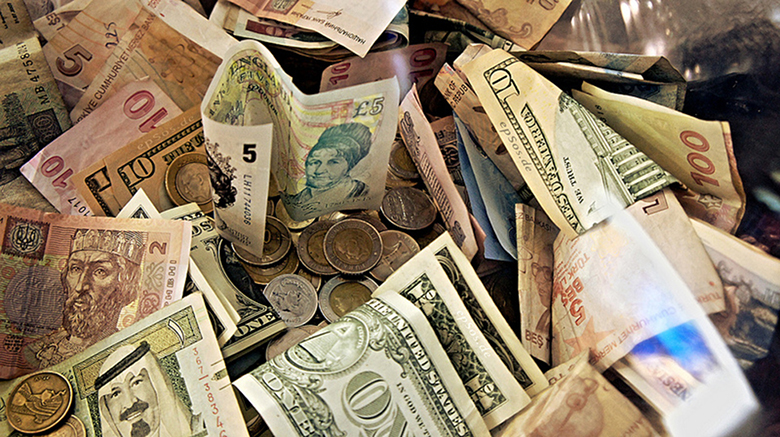
How much do you interact with the global financial system? Do you think not much? Think again. Suppose you take out a student loan, or you deposit money into your bank account. You just affected domestic savings and borrowing. Now say you are at the mall and buy two T-shirts “made in China,” and later contribute to a charity that helps refugees. What is the impact? You affected how much money flows into and out of the United States. If you open an IRA savings account and put money in an international mutual fund, you are involved in the flow of money overseas. While your involvement may not seem as influential as someone like the president, who can increase or decrease foreign aid and, thereby, have a huge impact on money flows in and out of the country, you do interact with the global financial system on a daily basis.

The balance of payments—a term you will meet soon—seems like a huge topic, but once you learn the specific components of trade and money, it all makes sense. Along the way, you may have to give up some common misunderstandings about trade and answer some questions: If a country is running a trade deficit, is that bad? Is a trade surplus good? For example, look at the Democratic Republic of Congo (often referred to as “Congo”), a large country in Central Africa. In 2013, it ran a trade surplus of $1 billion, so it must be doing well, right? In contrast, the trade deficit in the United States was $508 billion in 2013. Do these figures suggest that the economy in the United States is doing worse than the Congolese economy? Not necessarily. The U.S. trade deficit tends to worsen as the economy strengthens. In contrast, high poverty rates in the Congo persist, and these rates are not going down even with the positive trade balance. Clearly, it is more complicated than simply asserting that running a trade deficit is bad for the economy. You will learn more about these issues and others in this chapter.

Introduction to international trade and capital flows

In this chapter, you will learn about:

  • Measuring Trade Balances
  • Trade Balances in Historical and International Context
  • Trade Balances and Flows of Financial Capital
  • The National Saving and Investment Identity
  • The Pros and Cons of Trade Deficits and Surpluses
  • The Difference between Level of Trade and the Trade Balance

The balance of trade (or trade balance) is any gap between a nation’s dollar value of its exports, or what its producers sell abroad, and a nation’s dollar worth of imports, or the foreign-made products and services that households and businesses purchase. Recall from The Macroeconomic Perspective that if exports exceed imports, the economy is said to have a trade surplus    . If imports exceed exports, the economy is said to have a trade deficit    . If exports and imports are equal, then trade is balanced. But what happens when trade is out of balance and large trade surpluses or deficits exist?

Germany, for example, has had substantial trade surpluses in recent decades, in which exports have greatly exceeded imports. According to the Central Intelligence Agency’s The World Factbook, in 2013, Germany ran a trade surplus of $260 billion. In contrast, the U.S. economy in recent decades has experienced large trade deficits, in which imports have considerably exceeded exports. In 2014, for example, U.S. imports exceeded exports by $539 billion.

A series of financial crises triggered by unbalanced trade can lead economies into deep recessions. These crises begin with large trade deficits. At some point, foreign investors become pessimistic about the economy and move their money to other countries. The economy then drops into deep recession, with real GDP often falling up to 10% or more in a single year. This happened to Mexico in 1995 when their GDP fell 8.1%. A number of countries in East Asia—Thailand, South Korea, Malaysia, and Indonesia—came down with the same economic illness in 1997–1998 (called the Asian Financial Crisis). In the late 1990s and into the early 2000s, Russia and Argentina had the identical experience. What are the connections between imbalances of trade in goods and services and the flows of international financial capital that set off these economic avalanches?

We will start by examining the balance of trade in more detail, by looking at some patterns of trade balances in the United States and around the world. Then we will examine the intimate connection between international flows of goods and services and international flows of financial capital, which to economists are really just two sides of the same coin. It is often assumed that trade surpluses like those in Germany must be a positive sign for an economy, while trade deficits like those in the United States must be harmful. As it turns out, both trade surpluses and deficits can be either good or bad. We will see why in this chapter.

Questions & Answers

differentiate between demand and supply giving examples
Lambiv Reply
differentiated between demand and supply using examples
Lambiv
what is labour ?
Lambiv
how will I do?
Venny Reply
how is the graph works?I don't fully understand
Rezat Reply
information
Eliyee
devaluation
Eliyee
t
WARKISA
hi guys good evening to all
Lambiv
multiple choice question
Aster Reply
appreciation
Eliyee
explain perfect market
Lindiwe Reply
In economics, a perfect market refers to a theoretical construct where all participants have perfect information, goods are homogenous, there are no barriers to entry or exit, and prices are determined solely by supply and demand. It's an idealized model used for analysis,
Ezea
What is ceteris paribus?
Shukri Reply
other things being equal
AI-Robot
When MP₁ becomes negative, TP start to decline. Extuples Suppose that the short-run production function of certain cut-flower firm is given by: Q=4KL-0.6K2 - 0.112 • Where is quantity of cut flower produced, I is labour input and K is fixed capital input (K-5). Determine the average product of lab
Kelo
Extuples Suppose that the short-run production function of certain cut-flower firm is given by: Q=4KL-0.6K2 - 0.112 • Where is quantity of cut flower produced, I is labour input and K is fixed capital input (K-5). Determine the average product of labour (APL) and marginal product of labour (MPL)
Kelo
yes,thank you
Shukri
Can I ask you other question?
Shukri
what is monopoly mean?
Habtamu Reply
What is different between quantity demand and demand?
Shukri Reply
Quantity demanded refers to the specific amount of a good or service that consumers are willing and able to purchase at a give price and within a specific time period. Demand, on the other hand, is a broader concept that encompasses the entire relationship between price and quantity demanded
Ezea
ok
Shukri
how do you save a country economic situation when it's falling apart
Lilia Reply
what is the difference between economic growth and development
Fiker Reply
Economic growth as an increase in the production and consumption of goods and services within an economy.but Economic development as a broader concept that encompasses not only economic growth but also social & human well being.
Shukri
production function means
Jabir
What do you think is more important to focus on when considering inequality ?
Abdisa Reply
any question about economics?
Awais Reply
sir...I just want to ask one question... Define the term contract curve? if you are free please help me to find this answer 🙏
Asui
it is a curve that we get after connecting the pareto optimal combinations of two consumers after their mutually beneficial trade offs
Awais
thank you so much 👍 sir
Asui
In economics, the contract curve refers to the set of points in an Edgeworth box diagram where both parties involved in a trade cannot be made better off without making one of them worse off. It represents the Pareto efficient allocations of goods between two individuals or entities, where neither p
Cornelius
In economics, the contract curve refers to the set of points in an Edgeworth box diagram where both parties involved in a trade cannot be made better off without making one of them worse off. It represents the Pareto efficient allocations of goods between two individuals or entities,
Cornelius
Suppose a consumer consuming two commodities X and Y has The following utility function u=X0.4 Y0.6. If the price of the X and Y are 2 and 3 respectively and income Constraint is birr 50. A,Calculate quantities of x and y which maximize utility. B,Calculate value of Lagrange multiplier. C,Calculate quantities of X and Y consumed with a given price. D,alculate optimum level of output .
Feyisa Reply
Answer
Feyisa
c
Jabir
the market for lemon has 10 potential consumers, each having an individual demand curve p=101-10Qi, where p is price in dollar's per cup and Qi is the number of cups demanded per week by the i th consumer.Find the market demand curve using algebra. Draw an individual demand curve and the market dema
Gsbwnw Reply
suppose the production function is given by ( L, K)=L¼K¾.assuming capital is fixed find APL and MPL. consider the following short run production function:Q=6L²-0.4L³ a) find the value of L that maximizes output b)find the value of L that maximizes marginal product
Abdureman
types of unemployment
Yomi Reply
What is the difference between perfect competition and monopolistic competition?
Mohammed

Get Jobilize Job Search Mobile App in your pocket Now!

Get it on Google Play Download on the App Store Now


Source:  OpenStax, Principles of economics. OpenStax CNX. Sep 19, 2014 Download for free at http://legacy.cnx.org/content/col11613/1.11
Google Play and the Google Play logo are trademarks of Google Inc.

Notification Switch

Would you like to follow the 'Principles of economics' conversation and receive update notifications?

Ask