<< Chapter < Page Chapter >> Page >

By the end of this section, you will be able to:

  • Understand how fiscal policy and monetary policy are interconnected
  • Explain the three lag times that often occur when solving economic problems.
  • Identify the legal and political challenges of responding to an economic problem.

In the early 1960s, many leading economists believed that the problem of the business cycle, and the swings between cyclical unemployment and inflation, were a thing of the past. On the cover of its December 31, 1965, issue, Time magazine, then the premier news magazine in the United States, ran a picture of John Maynard Keynes , and the story inside identified Keynesian theories as “the prime influence on the world’s economies.” The article reported that policymakers have “used Keynesian principles not only to avoid the violent [business] cycles of prewar days but to produce phenomenal economic growth and to achieve remarkably stable prices.”

This happy consensus, however, did not last. The U.S. economy suffered one recession from December 1969 to November 1970, a deeper recession from November 1973 to March 1975, and then double-dip recessions from January to June 1980 and from July 1981 to November 1982. At various times, inflation and unemployment both soared. Clearly, the problems of macroeconomic policy had not been completely solved. As economists began to consider what had gone wrong, they identified a number of issues that make discretionary fiscal policy more difficult than it had seemed in the rosy optimism of the mid-1960s.

Fiscal policy and interest rates

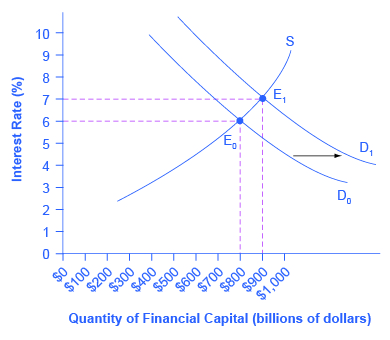
Because fiscal policy affects the quantity that the government borrows in financial capital markets , it not only affects aggregate demand—it can also affect interest rates. In [link] , the original equilibrium (E 0 ) in the financial capital market occurs at a quantity of $800 billion and an interest rate of 6%. However, an increase in government budget deficits shifts the demand for financial capital from D 0 to D 1 . The new equilibrium (E 1 ) occurs at a quantity of $900 billion and an interest rate of 7%.

A consensus estimate based on a number of studies is that an increase in budget deficits (or a fall in budget surplus) by 1% of GDP will cause an increase of 0.5–1.0% in the long-term interest rate.

Fiscal policy and interest rates

The graph shows two demand curves that each intersect with a supply curve. Demand curve (D sub 0) intersects with supply curve (S) at E sub 0 (point $800, 6%). Demand curve (D sub 1) intersects with supply curve (S) at E sub 1 (point $900, 7%).
When a government borrows money in the financial capital market, it causes a shift in the demand for financial capital from D 0 to D 1 . As the equilibrium moves from E 0 to E 1 , the equilibrium interest rate rises from 6% to 7% in this example. In this way, an expansionary fiscal policy intended to shift aggregate demand to the right can also lead to a higher interest rate, which has the effect of shifting aggregate demand back to the left.

A problem arises here. An expansionary fiscal policy, with tax cuts or spending increases, is intended to increase aggregate demand. If an expansionary fiscal policy also causes higher interest rates, then firms and households are discouraged from borrowing and spending (as occurs with tight monetary policy), thus reducing aggregate demand. Even if the direct effect of expansionary fiscal policy on increasing demand is not totally offset by lower aggregate demand from higher interest rates, fiscal policy can end up being less powerful than was originally expected. This is referred to as crowding out    , where government borrowing and spending results in higher interest rates, which reduces business investment and household consumption.

Questions & Answers

how do you get the 2/50
Abba Reply
number of sport play by 50 student construct discrete data
Aminu Reply
width of the frangebany leaves on how to write a introduction
Theresa Reply
Solve the mean of variance
Veronica Reply
Step 1: Find the mean. To find the mean, add up all the scores, then divide them by the number of scores. ... Step 2: Find each score's deviation from the mean. ... Step 3: Square each deviation from the mean. ... Step 4: Find the sum of squares. ... Step 5: Divide the sum of squares by n – 1 or N.
kenneth
what is error
Yakuba Reply
Is mistake done to something
Vutshila
Hy
anas
hy
What is the life teble
anas
hy
Jibrin
statistics is the analyzing of data
Tajudeen Reply
what is statics?
Zelalem Reply
how do you calculate mean
Gloria Reply
diveving the sum if all values
Shaynaynay
let A1,A2 and A3 events be independent,show that (A1)^c, (A2)^c and (A3)^c are independent?
Fisaye Reply
what is statistics
Akhisani Reply
data collected all over the world
Shaynaynay
construct a less than and more than table
Imad Reply
The sample of 16 students is taken. The average age in the sample was 22 years with astandard deviation of 6 years. Construct a 95% confidence interval for the age of the population.
Aschalew Reply
Bhartdarshan' is an internet-based travel agency wherein customer can see videos of the cities they plant to visit. The number of hits daily is a normally distributed random variable with a mean of 10,000 and a standard deviation of 2,400 a. what is the probability of getting more than 12,000 hits? b. what is the probability of getting fewer than 9,000 hits?
Akshay Reply
Bhartdarshan'is an internet-based travel agency wherein customer can see videos of the cities they plan to visit. The number of hits daily is a normally distributed random variable with a mean of 10,000 and a standard deviation of 2,400. a. What is the probability of getting more than 12,000 hits
Akshay
1
Bright
Sorry i want to learn more about this question
Bright
Someone help
Bright
a= 0.20233 b=0.3384
Sufiyan
a
Shaynaynay
How do I interpret level of significance?
Mohd Reply
It depends on your business problem or in Machine Learning you could use ROC- AUC cruve to decide the threshold value
Shivam
how skewness and kurtosis are used in statistics
Owen Reply
yes what is it
Taneeya
Got questions? Join the online conversation and get instant answers!
Jobilize.com Reply

Get Jobilize Job Search Mobile App in your pocket Now!

Get it on Google Play Download on the App Store Now


Source:  OpenStax, Macroeconomics. OpenStax CNX. Jun 16, 2014 Download for free at http://legacy.cnx.org/content/col11626/1.10
Google Play and the Google Play logo are trademarks of Google Inc.

Notification Switch

Would you like to follow the 'Macroeconomics' conversation and receive update notifications?

Ask