<< Chapter < Page Chapter >> Page >

Some modern economists have argued in a Keynesian spirit that, along with wages, other prices may be sticky, too. Many firms do not change their prices every day or even every month. When a firm considers changing prices, it must consider two sets of costs. First, changing prices uses company resources: managers must analyze the competition and market demand and decide what the new prices will be, sales materials must be updated, billing records will change, and product labels and price labels must be redone. Second, frequent price changes may leave customers confused or angry—especially if they find out that a product now costs more than expected. These costs of changing prices are called menu costs    —like the costs of printing up a new set of menus with different prices in a restaurant. Prices do respond to forces of supply and demand, but from a macroeconomic perspective, the process of changing all prices throughout the economy takes time.

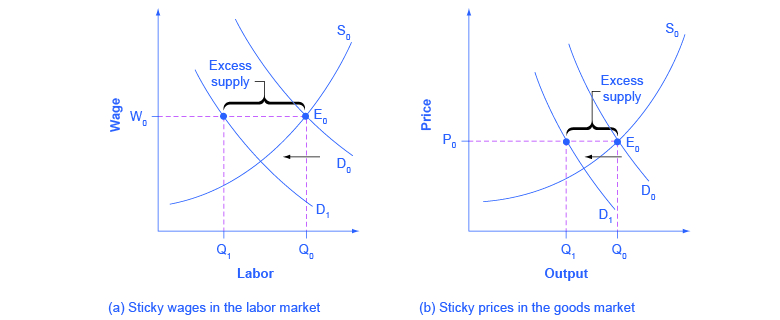
To understand the effect of sticky wages and prices in the economy, consider [link] (a) illustrating the overall labor market, while [link] (b) illustrates a market for a specific good or service. The original equilibrium (E 0 ) in each market occurs at the intersection of the demand curve (D 0 ) and supply curve (S 0 ). When aggregate demand declines, the demand for labor shifts to the left (to D 1 ) in [link] (a) and the demand for goods shifts to the left (to D 1 ) in [link] (b). However, because of sticky wages and prices, the wage remains at its original level (W 0 ) for a period of time and the price remains at its original level (P 0 ).

As a result, a situation of excess supply—where the quantity supplied exceeds the quantity demanded at the existing wage or price—exists in markets for both labor and goods, and Q 1 is less than Q 0 in both [link] (a) and [link] (b). When many labor markets and many goods markets all across the economy find themselves in this position, the economy is in a recession; that is, firms cannot sell what they wish to produce at the existing market price and do not wish to hire all who are willing to work at the existing market wage. The Clear It Up feature discusses this problem in more detail.

Sticky prices and falling demand in the labor and goods market

The two graphs show how sticky wages have varying effects based on whether the market is a labor market or a goods market.
In both (a) and (b), demand shifts left from D 0 to D 1 . However, the wage in (a) and the price in (b) do not immediately decline. In (a), the quantity demanded of labor at the original wage (W 0 ) is Q 0 , but with the new demand curve for labor (D 1 ), it will be Q 1 . Similarly, in (b), the quantity demanded of goods at the original price (P 0 ) is Q 0 , but at the new demand curve (D 1 ) it will be Q 1 . An excess supply of labor will exist, which is called unemployment. An excess supply of goods will also exist, where the quantity demanded is substantially less than the quantity supplied. Thus, sticky wages and sticky prices, combined with a drop in demand, bring about unemployment and recession.

Why is the pace of wage adjustments slow?

The recovery after the Great Recession in the United States has been slow, with wages stagnant, if not declining. In fact, many low-wage workers at McDonalds, Dominos, and Walmart have threatened to strike for higher wages. Their plight is part of a larger trend in job growth and pay in the post–recession recovery.

Jobs lost/gained in the recession/recovery

The chart on the left shows that the majority of jobs lost during the recession were from people working mid-wage occupations (60%). The chart on the right shows that the majority of jobs gained during the recovery were from people working lower-wage occupations (58%).
Data in the aftermath of the Great Recession suggests that jobs lost were in mid-wage occupations, while jobs gained were in low-wage occupations.

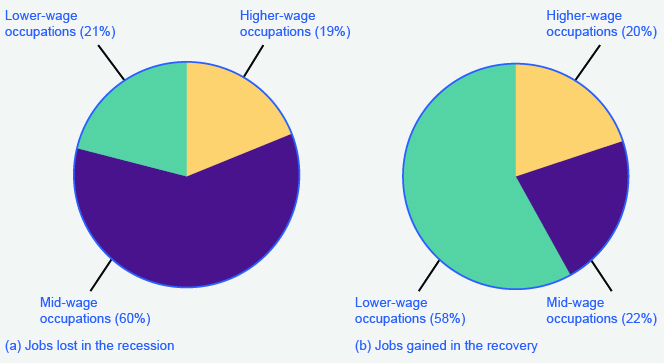
The National Employment Law Project compiled data from the Bureau of Labor Statistics and found that, during the Great Recession, 60% of job losses were in medium-wage occupations. Most of them were replaced during the recovery period with lower-wage jobs in the service, retail, and food industries. This data is illustrated in [link] .

Wages in the service, retail, and food industries are at or near minimum wage and tend to be both downwardly and upwardly “sticky.” Wages are downwardly sticky due to minimum wage laws; they may be upwardly sticky if insufficient competition in low-skilled labor markets enables employers to avoid raising wages that would reduce their profits. At the same time, however, the Consumer Price Index increased 11% between 2007 and 2012, pushing real wages down.

Questions & Answers

What is inflation
Bright Reply
a general and ongoing rise in the level of prices in an economy
AI-Robot
What are the factors that affect demand for a commodity
Florence Reply
price
Kenu
differentiate between demand and supply giving examples
Lambiv Reply
differentiated between demand and supply using examples
Lambiv
what is labour ?
Lambiv
how will I do?
Venny Reply
how is the graph works?I don't fully understand
Rezat Reply
information
Eliyee
devaluation
Eliyee
t
WARKISA
hi guys good evening to all
Lambiv
multiple choice question
Aster Reply
appreciation
Eliyee
explain perfect market
Lindiwe Reply
In economics, a perfect market refers to a theoretical construct where all participants have perfect information, goods are homogenous, there are no barriers to entry or exit, and prices are determined solely by supply and demand. It's an idealized model used for analysis,
Ezea
What is ceteris paribus?
Shukri Reply
other things being equal
AI-Robot
When MP₁ becomes negative, TP start to decline. Extuples Suppose that the short-run production function of certain cut-flower firm is given by: Q=4KL-0.6K2 - 0.112 • Where is quantity of cut flower produced, I is labour input and K is fixed capital input (K-5). Determine the average product of lab
Kelo
Extuples Suppose that the short-run production function of certain cut-flower firm is given by: Q=4KL-0.6K2 - 0.112 • Where is quantity of cut flower produced, I is labour input and K is fixed capital input (K-5). Determine the average product of labour (APL) and marginal product of labour (MPL)
Kelo
yes,thank you
Shukri
Can I ask you other question?
Shukri
what is monopoly mean?
Habtamu Reply
What is different between quantity demand and demand?
Shukri Reply
Quantity demanded refers to the specific amount of a good or service that consumers are willing and able to purchase at a give price and within a specific time period. Demand, on the other hand, is a broader concept that encompasses the entire relationship between price and quantity demanded
Ezea
ok
Shukri
how do you save a country economic situation when it's falling apart
Lilia Reply
what is the difference between economic growth and development
Fiker Reply
Economic growth as an increase in the production and consumption of goods and services within an economy.but Economic development as a broader concept that encompasses not only economic growth but also social & human well being.
Shukri
production function means
Jabir
What do you think is more important to focus on when considering inequality ?
Abdisa Reply
any question about economics?
Awais Reply
sir...I just want to ask one question... Define the term contract curve? if you are free please help me to find this answer 🙏
Asui
it is a curve that we get after connecting the pareto optimal combinations of two consumers after their mutually beneficial trade offs
Awais
thank you so much 👍 sir
Asui
In economics, the contract curve refers to the set of points in an Edgeworth box diagram where both parties involved in a trade cannot be made better off without making one of them worse off. It represents the Pareto efficient allocations of goods between two individuals or entities, where neither p
Cornelius
In economics, the contract curve refers to the set of points in an Edgeworth box diagram where both parties involved in a trade cannot be made better off without making one of them worse off. It represents the Pareto efficient allocations of goods between two individuals or entities,
Cornelius
Suppose a consumer consuming two commodities X and Y has The following utility function u=X0.4 Y0.6. If the price of the X and Y are 2 and 3 respectively and income Constraint is birr 50. A,Calculate quantities of x and y which maximize utility. B,Calculate value of Lagrange multiplier. C,Calculate quantities of X and Y consumed with a given price. D,alculate optimum level of output .
Feyisa Reply
Answer
Feyisa
c
Jabir
Got questions? Join the online conversation and get instant answers!
Jobilize.com Reply

Get Jobilize Job Search Mobile App in your pocket Now!

Get it on Google Play Download on the App Store Now


Source:  OpenStax, Macroeconomics. OpenStax CNX. Jun 16, 2014 Download for free at http://legacy.cnx.org/content/col11626/1.10
Google Play and the Google Play logo are trademarks of Google Inc.

Notification Switch

Would you like to follow the 'Macroeconomics' conversation and receive update notifications?

Ask