<< Chapter < Page Chapter >> Page >

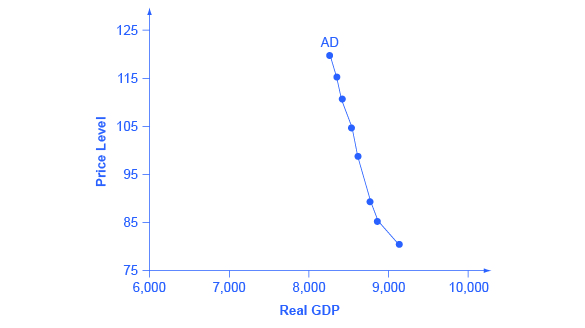
[link] presents an aggregate demand (AD) curve. Just like the aggregate supply curve, the horizontal axis shows real GDP and the vertical axis shows the price level. The AD curve slopes down, which means that increases in the price level of outputs lead to a lower quantity of total spending. The reasons behind this shape are related to how changes in the price level affect the different components of aggregate demand. The following components make up aggregate demand: consumption spending (C), investment spending (I), government spending (G), and spending on exports (X) minus imports (M): C + I + G + X – M.

The aggregate demand curve

The graph shows a downward sloping aggregate demand curve.
Aggregate demand (AD) slopes down, showing that, as the price level rises, the amount of total spending on domestic goods and services declines.

The wealth effect holds that as the price level increases, the buying power of savings that people have stored up in bank accounts and other assets will diminish, eaten away to some extent by inflation. Because a rise in the price level reduces people’s wealth, consumption spending will fall as the price level rises.

The interest rate effect is that as prices for outputs rise, the same purchases will take more money or credit to accomplish. This additional demand for money and credit will push interest rates higher. In turn, higher interest rates will reduce borrowing by businesses for investment purposes and reduce borrowing by households for homes and cars—thus reducing consumption and investment spending.

The foreign price effect points out that if prices rise in the United States while remaining fixed in other countries, then goods in the United States will be relatively more expensive compared to goods in the rest of the world. U.S. exports    will be relatively more expensive, and the quantity of exports sold will fall. U.S. imports    from abroad will be relatively cheaper, so the quantity of imports will rise. Thus, a higher domestic price level, relative to price levels in other countries, will reduce net export expenditures.

Truth be told, among economists all three of these effects are controversial, in part because they do not seem to be very large. For this reason, the aggregate demand curve in [link] slopes downward fairly steeply; the steep slope indicates that a higher price level for final outputs reduces aggregate demand for all three of these reasons, but that the change in the quantity of aggregate demand as a result of changes in price level is not very large.

Read the following Work It Out feature to learn how to interpret the AD/AS model. In this example, aggregate supply, aggregate demand, and the price level are given for the imaginary country of Xurbia.

Interpreting the ad/as model

[link] shows information on aggregate supply, aggregate demand, and the price level for the imaginary country of Xurbia. What information does [link] tell you about the state of the Xurbia’s economy? Where is the equilibrium price level and output level (this is the SR macroequilibrium)? Is Xurbia risking inflationary pressures or facing high unemployment? How can you tell?

Price level: aggregate demand/aggregate supply
Price Level Aggregate Demand Aggregate Supply
110 $700 $600
120 $690 $640
130 $680 $680
140 $670 $720
150 $660 $740
160 $650 $760
170 $640 $770

To begin to use the AD/AS model, it is important to plot the AS and AD curves from the data provided. What is the equilibrium?

Step 1. Draw your x- and y-axis. Label the x-axis Real GDP and the y-axis Price Level.

Step 2. Plot AD on your graph.

Step 3. Plot AS on your graph.

Step 4. Look at [link] which provides a visual to aid in your analysis.

The ad/as curves

The figure shows a downward sloping aggregate demand line intersecting with an aggregate supply curve at approximately (680, 130).
AD and AS curves created from the data in [link] .

Step 5. Determine where AD and AS intersect. This is the equilibrium with price level at 130 and real GDP at $680.

Step 6. Look at the graph to determine where equilibrium is located. We can see that this equilibrium is fairly far from where the AS curve becomes near-vertical (or at least quite steep) which seems to start at about $750 of real output. This implies that the economy is not close to potential GDP. Thus, unemployment will be high. In the relatively flat part of the AS curve, where the equilibrium occurs, changes in the price level will not be a major concern, since such changes are likely to be small.

Step 7. Determine what the steep portion of the AS curve indicates. Where the AS curve is steep, the economy is at or close to potential GDP.

Step 8. Draw conclusions from the given information:

  • If equilibrium occurs in the flat range of AS, then economy is not close to potential GDP and will be experiencing unemployment, but stable price level.
  • If equilibrium occurs in the steep range of AS, then the economy is close or at potential GDP and will be experiencing rising price levels or inflationary pressures, but will have a low unemployment rate.

Questions & Answers

What is inflation
Bright Reply
a general and ongoing rise in the level of prices in an economy
AI-Robot
What are the factors that affect demand for a commodity
Florence Reply
price
Kenu
differentiate between demand and supply giving examples
Lambiv Reply
differentiated between demand and supply using examples
Lambiv
what is labour ?
Lambiv
how will I do?
Venny Reply
how is the graph works?I don't fully understand
Rezat Reply
information
Eliyee
devaluation
Eliyee
t
WARKISA
hi guys good evening to all
Lambiv
multiple choice question
Aster Reply
appreciation
Eliyee
explain perfect market
Lindiwe Reply
In economics, a perfect market refers to a theoretical construct where all participants have perfect information, goods are homogenous, there are no barriers to entry or exit, and prices are determined solely by supply and demand. It's an idealized model used for analysis,
Ezea
What is ceteris paribus?
Shukri Reply
other things being equal
AI-Robot
When MP₁ becomes negative, TP start to decline. Extuples Suppose that the short-run production function of certain cut-flower firm is given by: Q=4KL-0.6K2 - 0.112 • Where is quantity of cut flower produced, I is labour input and K is fixed capital input (K-5). Determine the average product of lab
Kelo
Extuples Suppose that the short-run production function of certain cut-flower firm is given by: Q=4KL-0.6K2 - 0.112 • Where is quantity of cut flower produced, I is labour input and K is fixed capital input (K-5). Determine the average product of labour (APL) and marginal product of labour (MPL)
Kelo
yes,thank you
Shukri
Can I ask you other question?
Shukri
what is monopoly mean?
Habtamu Reply
What is different between quantity demand and demand?
Shukri Reply
Quantity demanded refers to the specific amount of a good or service that consumers are willing and able to purchase at a give price and within a specific time period. Demand, on the other hand, is a broader concept that encompasses the entire relationship between price and quantity demanded
Ezea
ok
Shukri
how do you save a country economic situation when it's falling apart
Lilia Reply
what is the difference between economic growth and development
Fiker Reply
Economic growth as an increase in the production and consumption of goods and services within an economy.but Economic development as a broader concept that encompasses not only economic growth but also social & human well being.
Shukri
production function means
Jabir
What do you think is more important to focus on when considering inequality ?
Abdisa Reply
any question about economics?
Awais Reply
sir...I just want to ask one question... Define the term contract curve? if you are free please help me to find this answer 🙏
Asui
it is a curve that we get after connecting the pareto optimal combinations of two consumers after their mutually beneficial trade offs
Awais
thank you so much 👍 sir
Asui
In economics, the contract curve refers to the set of points in an Edgeworth box diagram where both parties involved in a trade cannot be made better off without making one of them worse off. It represents the Pareto efficient allocations of goods between two individuals or entities, where neither p
Cornelius
In economics, the contract curve refers to the set of points in an Edgeworth box diagram where both parties involved in a trade cannot be made better off without making one of them worse off. It represents the Pareto efficient allocations of goods between two individuals or entities,
Cornelius
Suppose a consumer consuming two commodities X and Y has The following utility function u=X0.4 Y0.6. If the price of the X and Y are 2 and 3 respectively and income Constraint is birr 50. A,Calculate quantities of x and y which maximize utility. B,Calculate value of Lagrange multiplier. C,Calculate quantities of X and Y consumed with a given price. D,alculate optimum level of output .
Feyisa Reply
Answer
Feyisa
c
Jabir
Got questions? Join the online conversation and get instant answers!
Jobilize.com Reply

Get Jobilize Job Search Mobile App in your pocket Now!

Get it on Google Play Download on the App Store Now


Source:  OpenStax, Macroeconomics. OpenStax CNX. Jun 16, 2014 Download for free at http://legacy.cnx.org/content/col11626/1.10
Google Play and the Google Play logo are trademarks of Google Inc.

Notification Switch

Would you like to follow the 'Macroeconomics' conversation and receive update notifications?

Ask