<< Chapter < Page Chapter >> Page >
A photograph shows a line of men being served soup in front of St. Peter’s Mission in New York City.
In the early 1930s, without significant government relief programs, many people in urban centers relied on private agencies for assistance. In New York City, St. Peter’s Mission distributed bread, soup, and canned goods to large numbers of the unemployed and others in need.

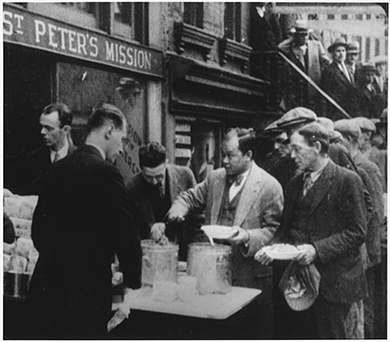
Unable to receive aid from the government, Americans thus turned to private charities; churches, synagogues, and other religious organizations; and state aid. But these organizations were not prepared to deal with the scope of the problem. Private aid organizations showed declining assets as well during the Depression, with fewer Americans possessing the ability to donate to such charities. Likewise, state governments were particularly ill-equipped. Governor Franklin D. Roosevelt was the first to institute a Department of Welfare in New York in 1929. City governments had equally little to offer. In New York City in 1932, family allowances were $2.39 per week, and only one-half of the families who qualified actually received them. In Detroit, allowances fell to fifteen cents a day per person, and eventually ran out completely. In most cases, relief was only in the form of food and fuel; organizations provided nothing in the way of rent, shelter, medical care, clothing, or other necessities. There was no infrastructure to support the elderly, who were the most vulnerable, and this population largely depended on their adult children to support them, adding to families’ burdens ( [link] ).

A photograph shows an elderly destitute man leaning against a vacant storefront in San Francisco, California. The window is covered with signs indicating various properties that are “to lease.”
Because there was no infrastructure to support them should they become unemployed or destitute, the elderly were extremely vulnerable during the Great Depression. As the depression continued, the results of this tenuous situation became more evident, as shown in this photo of a vacant storefront in San Francisco, captured by Dorothea Lange in 1935.

During this time, local community groups, such as police and teachers, worked to help the neediest. New York City police, for example, began contributing 1 percent of their salaries to start a food fund that was geared to help those found starving on the streets. In 1932, New York City schoolteachers also joined forces to try to help; they contributed as much as $250,000 per month from their own salaries to help needy children. Chicago teachers did the same, feeding some eleven thousand students out of their own pockets in 1931, despite the fact that many of them had not been paid a salary in months. These noble efforts, however, failed to fully address the level of desperation that the American public was facing.

Section summary

The prosperous decade leading up to the stock market crash of 1929, with easy access to credit and a culture that encouraged speculation and risk-taking, put into place the conditions for the country’s fall. The stock market, which had been growing for years, began to decline in the summer and early fall of 1929, precipitating a panic that led to a massive stock sell-off in late October. In one month, the market lost close to 40 percent of its value. Although only a small percentage of Americans had invested in the stock market, the crash affected everyone. Banks lost millions and, in response, foreclosed on business and personal loans, which in turn pressured customers to pay back their loans, whether or not they had the cash. As the pressure mounted on individuals, the effects of the crash continued to spread. The state of the international economy, the inequitable income distribution in the United States, and, perhaps most importantly, the contagion effect of panic all played roles in the continued downward spiral of the economy.

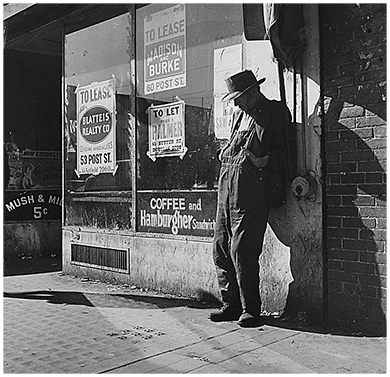
In the immediate aftermath of the crash, the government was confident that the economy would rebound. But several factors led it to worsen instead. One significant issue was the integral role of automobiles and construction in American industry. With the crash, there was no money for either auto purchases or major construction projects; these industries therefore suffered, laying off workers, cutting wages, and reducing benefits. Affluent Americans considered the deserving poor—those who lost their money due to no fault of their own—to be especially in need of help. But at the outset of the Great Depression, there were few social safety nets in place to provide them with the necessary relief. While some families retained their wealth and middle-class lifestyle, many more were plunged quite suddenly into poverty and often homelessness. Children dropped out of school, mothers and wives went into domestic service, and the fabric of American society changed inexorably.

Questions & Answers

What are the factors that affect demand for a commodity
Florence Reply
differentiate between demand and supply giving examples
Lambiv Reply
differentiated between demand and supply using examples
Lambiv
what is labour ?
Lambiv
how will I do?
Venny Reply
how is the graph works?I don't fully understand
Rezat Reply
information
Eliyee
devaluation
Eliyee
t
WARKISA
hi guys good evening to all
Lambiv
multiple choice question
Aster Reply
appreciation
Eliyee
explain perfect market
Lindiwe Reply
In economics, a perfect market refers to a theoretical construct where all participants have perfect information, goods are homogenous, there are no barriers to entry or exit, and prices are determined solely by supply and demand. It's an idealized model used for analysis,
Ezea
What is ceteris paribus?
Shukri Reply
other things being equal
AI-Robot
When MP₁ becomes negative, TP start to decline. Extuples Suppose that the short-run production function of certain cut-flower firm is given by: Q=4KL-0.6K2 - 0.112 • Where is quantity of cut flower produced, I is labour input and K is fixed capital input (K-5). Determine the average product of lab
Kelo
Extuples Suppose that the short-run production function of certain cut-flower firm is given by: Q=4KL-0.6K2 - 0.112 • Where is quantity of cut flower produced, I is labour input and K is fixed capital input (K-5). Determine the average product of labour (APL) and marginal product of labour (MPL)
Kelo
yes,thank you
Shukri
Can I ask you other question?
Shukri
what is monopoly mean?
Habtamu Reply
What is different between quantity demand and demand?
Shukri Reply
Quantity demanded refers to the specific amount of a good or service that consumers are willing and able to purchase at a give price and within a specific time period. Demand, on the other hand, is a broader concept that encompasses the entire relationship between price and quantity demanded
Ezea
ok
Shukri
how do you save a country economic situation when it's falling apart
Lilia Reply
what is the difference between economic growth and development
Fiker Reply
Economic growth as an increase in the production and consumption of goods and services within an economy.but Economic development as a broader concept that encompasses not only economic growth but also social & human well being.
Shukri
production function means
Jabir
What do you think is more important to focus on when considering inequality ?
Abdisa Reply
any question about economics?
Awais Reply
sir...I just want to ask one question... Define the term contract curve? if you are free please help me to find this answer 🙏
Asui
it is a curve that we get after connecting the pareto optimal combinations of two consumers after their mutually beneficial trade offs
Awais
thank you so much 👍 sir
Asui
In economics, the contract curve refers to the set of points in an Edgeworth box diagram where both parties involved in a trade cannot be made better off without making one of them worse off. It represents the Pareto efficient allocations of goods between two individuals or entities, where neither p
Cornelius
In economics, the contract curve refers to the set of points in an Edgeworth box diagram where both parties involved in a trade cannot be made better off without making one of them worse off. It represents the Pareto efficient allocations of goods between two individuals or entities,
Cornelius
Suppose a consumer consuming two commodities X and Y has The following utility function u=X0.4 Y0.6. If the price of the X and Y are 2 and 3 respectively and income Constraint is birr 50. A,Calculate quantities of x and y which maximize utility. B,Calculate value of Lagrange multiplier. C,Calculate quantities of X and Y consumed with a given price. D,alculate optimum level of output .
Feyisa Reply
Answer
Feyisa
c
Jabir
the market for lemon has 10 potential consumers, each having an individual demand curve p=101-10Qi, where p is price in dollar's per cup and Qi is the number of cups demanded per week by the i th consumer.Find the market demand curve using algebra. Draw an individual demand curve and the market dema
Gsbwnw Reply
suppose the production function is given by ( L, K)=L¼K¾.assuming capital is fixed find APL and MPL. consider the following short run production function:Q=6L²-0.4L³ a) find the value of L that maximizes output b)find the value of L that maximizes marginal product
Abdureman
Got questions? Join the online conversation and get instant answers!
Jobilize.com Reply

Get Jobilize Job Search Mobile App in your pocket Now!

Get it on Google Play Download on the App Store Now


Source:  OpenStax, U.s. history. OpenStax CNX. Jan 12, 2015 Download for free at http://legacy.cnx.org/content/col11740/1.3
Google Play and the Google Play logo are trademarks of Google Inc.

Notification Switch

Would you like to follow the 'U.s. history' conversation and receive update notifications?

Ask