

| << Chapter < Page | Chapter >> Page > |
| Amount Worked (hours) | Total Earnings | Government Support | Total Income |
|---|---|---|---|
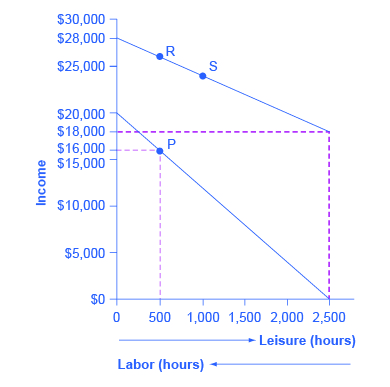
| 0 | 0 | $18,000 | $18,000 |
| 500 | $4,000 | $16,000 | $20,000 |
| 1,000 | $8,000 | $14,000 | $22,000 |
| 1,500 | $12,000 | $12,000 | $24,000 |
| 2,000 | $16,000 | $10,000 | $26,000 |
| 2,500 | $20,000 | $8,000 | $28,000 |
The next module will consider a variety of government support programs focused specifically on the poor, including welfare, SNAP (food supplement), Medicaid, and the earned income tax credit (EITC). Although these programs vary from state to state, it is generally a true statement that in many states from the 1960s into the 1980s, if poor people worked, their level of income barely rose—or did not rise at all—after the reduction in government support payments was factored in. The following Work It Out feature shows how this happens.
Jason earns $9.00 an hour, and a government antipoverty program provides a floor of $10,000 guaranteed income. The government reduces government support by $0.50 for each $1.00 earned. What are the horizontal and vertical intercepts of the budget constraint line? Assume the maximum hours for work or leisure is 2,500 hours.
Step 1. Determine the amount of the government guaranteed income. In this case, it is $10,000.
Step 2. Plot that guaranteed income as a horizontal line on the budget constraint line.
Step 3. Determine what Jason earns if he has no income and enjoys 2,500 hours of leisure. In this case, he will receive the guaranteed $10,000 (the horizontal intercept).
Step 4. Calculate how much Jason’s salary will be reduced by due to the reduction in government income. In Jason’s case, it will be reduced by one half. He will, in effect, net only $4.50 an hour.
Step 5. If Jason works 1,000 hours, at a maximum what income will Jason receive? Jason will get the government assistance of $10,000. He will net only $4.50 for every hour he chooses to work. If he works 1,000 hours at $4.50, his earned income is $4,500 plus the government income of $10,000. Thus the total maximum income (the vertical intercept) is $10,000 + $4,500 = $14,500.
A poverty trap occurs when government-support payments for the poor decline as the poor earn more income. As a result, the poor do not end up with much more income when they work, because the loss of government support largely or completely offsets any income that is earned by working. The bite of the poverty trap can be reduced by phasing out government benefits more slowly, as well as by imposing requirements for work as a condition of receiving benefits and a time limit on benefits.
Susan is a single mother with three children. She can earn $8 per hour and works up to 2,000 hours per year. However, if she does not earn any income at all, she will receive government benefits totaling $16,000 per year. For every $1 of income she earns, her level of government support will be reduced by $1. Create a table, patterned after [link] . The first column should show Susan’s choices of how many hours to work per year, up to 2,000 hours. The second column should show her earnings from work. The third column should show her level of government support, given her earnings. The final column should show her total income, combining earnings and government support.
Notification Switch
Would you like to follow the 'Principles of economics' conversation and receive update notifications?

|
|

|
|

|
|

|
|

|
|

|
|

|
|

|
|

|
|
|
|
|

|