<< Chapter < Page Chapter >> Page >

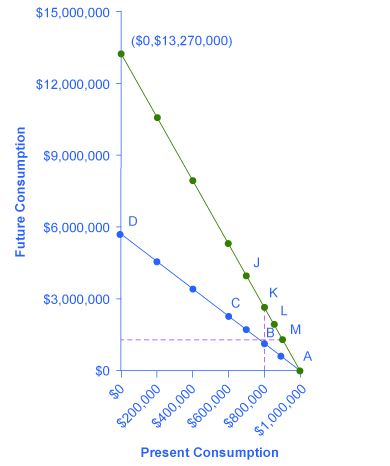
[link] and [link] show Yelberton’s intertemporal budget constraint . Yelberton’s choice involves comparing the utility of present consumption during his working life and future consumption after retirement. The rate of return that determines the slope of the intertemporal budget line between present consumption and future consumption in this example is the annual interest rate that he would earn on his savings, compounded over the 30 years of his working life. (For simplicity, we are assuming that any savings from current income will compound for 30 years.) Thus, in the lower budget constraint line on the figure, future consumption grows by increments of $574,000, because each time $100,000 is saved in the present, it compounds to $574,000 after 30 years at a 6% interest rate. If some of the numbers on the future consumption axis look bizarrely large, remember that this occurs because of the power of compound interest over substantial periods of time, and because the figure is grouping together all of Yelberton’s saving for retirement over his lifetime.

Yelberton’s choice: the intertemporal budget set

The graph shows how present and future consumption choices are impacted by changes in rates of return.
Yelberton will make a choice between present and future consumption. With an annual rate of return of 6%, he decides that his utility will be highest at point B, which represents a choice of $800,000 in present consumption and $1,148,000 in future consumption. When the annual rate of return rises to 9%, the intertemporal budget constraint pivots up. Yelberton could choose to take the gains from this higher rate of return in several forms: more present saving and much higher future consumption (J), the same present saving and higher future consumption (K), more present consumption and more future consumption (L), or more present consumption and the same future consumption (M).
Yelburton’s intertemporal budget constraint
Present Consumption Present Savings Future Consumption (6% annual return) Future Consumption (9% annual return)
$1,000,000 0 0 0
$900,000 $100,000 $574,000 $1,327,000
$800,000 $200,000 $1,148,000 $2,654,000
$700,000 $300,000 $1,722,000 $3,981,000
$600,000 $400,000 $2,296,000 $5,308,000
$400,000 $600,000 $3,444,000 $7,962,000
$200,000 $800,000 $4,592,000 $10,616,000
0 $1,000,000 $5,740,000 $13,270,000

Yelberton will compare the different choices along the budget constraint    and choose the one that provides him with the highest utility. For example, he will compare the utility he would receive from a choice like point A, with consumption of $1 million in the present, zero savings, and zero future consumption; point B, with present consumption of $800,000, savings of $200,000, and future consumption of $1,148,000; point C, with present consumption of $600,000, savings of $400,000, and future consumption of $2,296,000; or even choice D, with present consumption of zero, savings of $1,000,000, and future consumption of $5,740,000. Yelberton will also ask himself questions like these: “Would I prefer to consume a little less in the present, save more, and have more future consumption?” or “Would I prefer to consume a little more in the present, save less, and have less future consumption?” By considering marginal changes toward more or less consumption, he can seek out the choice that will provide him with the highest level of utility.

Questions & Answers

Examine the distinction between theory of comparative cost Advantage and theory of factor proportion
Fatima Reply
What is inflation
Bright Reply
a general and ongoing rise in the level of prices in an economy
AI-Robot
What are the factors that affect demand for a commodity
Florence Reply
price
Kenu
differentiate between demand and supply giving examples
Lambiv Reply
differentiated between demand and supply using examples
Lambiv
what is labour ?
Lambiv
how will I do?
Venny Reply
how is the graph works?I don't fully understand
Rezat Reply
information
Eliyee
devaluation
Eliyee
t
WARKISA
hi guys good evening to all
Lambiv
multiple choice question
Aster Reply
appreciation
Eliyee
explain perfect market
Lindiwe Reply
In economics, a perfect market refers to a theoretical construct where all participants have perfect information, goods are homogenous, there are no barriers to entry or exit, and prices are determined solely by supply and demand. It's an idealized model used for analysis,
Ezea
What is ceteris paribus?
Shukri Reply
other things being equal
AI-Robot
When MP₁ becomes negative, TP start to decline. Extuples Suppose that the short-run production function of certain cut-flower firm is given by: Q=4KL-0.6K2 - 0.112 • Where is quantity of cut flower produced, I is labour input and K is fixed capital input (K-5). Determine the average product of lab
Kelo
Extuples Suppose that the short-run production function of certain cut-flower firm is given by: Q=4KL-0.6K2 - 0.112 • Where is quantity of cut flower produced, I is labour input and K is fixed capital input (K-5). Determine the average product of labour (APL) and marginal product of labour (MPL)
Kelo
yes,thank you
Shukri
Can I ask you other question?
Shukri
what is monopoly mean?
Habtamu Reply
What is different between quantity demand and demand?
Shukri Reply
Quantity demanded refers to the specific amount of a good or service that consumers are willing and able to purchase at a give price and within a specific time period. Demand, on the other hand, is a broader concept that encompasses the entire relationship between price and quantity demanded
Ezea
ok
Shukri
how do you save a country economic situation when it's falling apart
Lilia Reply
what is the difference between economic growth and development
Fiker Reply
Economic growth as an increase in the production and consumption of goods and services within an economy.but Economic development as a broader concept that encompasses not only economic growth but also social & human well being.
Shukri
production function means
Jabir
What do you think is more important to focus on when considering inequality ?
Abdisa Reply
any question about economics?
Awais Reply
sir...I just want to ask one question... Define the term contract curve? if you are free please help me to find this answer 🙏
Asui
it is a curve that we get after connecting the pareto optimal combinations of two consumers after their mutually beneficial trade offs
Awais
thank you so much 👍 sir
Asui
In economics, the contract curve refers to the set of points in an Edgeworth box diagram where both parties involved in a trade cannot be made better off without making one of them worse off. It represents the Pareto efficient allocations of goods between two individuals or entities, where neither p
Cornelius
In economics, the contract curve refers to the set of points in an Edgeworth box diagram where both parties involved in a trade cannot be made better off without making one of them worse off. It represents the Pareto efficient allocations of goods between two individuals or entities,
Cornelius

Get Jobilize Job Search Mobile App in your pocket Now!

Get it on Google Play Download on the App Store Now


Source:  OpenStax, Principles of economics. OpenStax CNX. Sep 19, 2014 Download for free at http://legacy.cnx.org/content/col11613/1.11
Google Play and the Google Play logo are trademarks of Google Inc.

Notification Switch

Would you like to follow the 'Principles of economics' conversation and receive update notifications?

Ask