<< Chapter < Page Chapter >> Page >

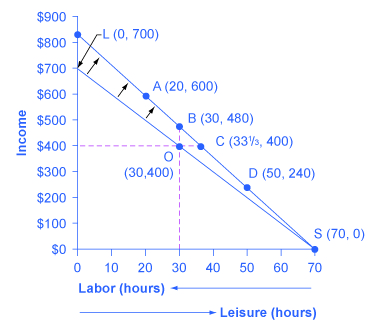
Vivian has 70 hours per week that she could devote either to work or to leisure, and her wage is $10/hour. The lower budget constraint in [link] shows Vivian’s possible choices. The horizontal axis of this diagram measures both leisure and labor, by showing how Vivian’s time is divided between leisure and labor. Hours of leisure are measured from left to right on the horizontal axis, while hours of labor are measured from right to left. Vivian will compare choices along this budget constraint, ranging from 70 hours of leisure and no income at point S to zero hours of leisure and $700 of income at point L. She will choose the point that provides her with the highest total utility. For this example, let’s assume that Vivian’s utility-maximizing choice occurs at O, with 30 hours of leisure, 40 hours of work, and $400 in weekly income.

How a rise in wages alters the utility-maximizing choice

The graph shows how raised wages can influence the opportunity set.
Vivian’s original choice is point O on the lower opportunity set. A rise in her wage causes her opportunity set to swing upward. In response to the increase in wages, Vivian can make a range of different choices available to her: a choice like D, which involves less work; and a choice like B, which involves the same amount of work but more income; or a choice like A, which involves more work and considerably more income. Vivian’s personal preferences will determine which choice she makes.

For Vivian to discover the labor-leisure choice that will maximize her utility, she does not have to place numerical values on the total and marginal utility that she would receive from every level of income and leisure. All that really matters is that Vivian can compare, in her own mind, whether she would prefer more leisure or more income, given the tradeoffs she faces. If Vivian can say to herself: “I’d really rather work a little less and have more leisure, even if it means less income,” or “I’d be willing to work more hours to make some extra income,” then as she gradually moves in the direction of her preferences, she will seek out the utility-maximizing choice on her labor-leisure budget constraint.

Now imagine that Vivian’s wage level increases to $12/hour. A higher wage will mean a new budget constraint that tilts up more steeply; conversely, a lower wage would have led to a new budget constraint that was flatter. How will a change in the wage and the corresponding shift in the budget constraint affect Vivian’s decisions about how many hours to work?

Vivian’s choices of quantity of hours to work and income along her new budget constraint can be divided into several categories, using the dashed horizontal and vertical lines in [link] that go through her original choice (O). One set of choices in the upper-left portion of the new budget constraint involves more hours of work (that is, less leisure) and more income, at a point like A with 20 hours of leisure, 50 hours of work, and $600 of income (that is, 50 hours of work multiplied by the new wage of $12 per hour). A second choice would be to work exactly the same 40 hours, and to take the benefits of the higher wage in the form of income that would now be $480, at choice B. A third choice would involve more leisure and the same income at point C (that is, 33-1/3 hours of work multiplied by the new wage of $12 per hour equals $400 of total income). A fourth choice would involve less income and much more leisure at a point like D, with a choice like 50 hours of leisure, 20 hours of work, and $240 in income.

Questions & Answers

differentiate between demand and supply giving examples
Lambiv Reply
differentiated between demand and supply using examples
Lambiv
what is labour ?
Lambiv
how will I do?
Venny Reply
how is the graph works?I don't fully understand
Rezat Reply
information
Eliyee
devaluation
Eliyee
t
WARKISA
hi guys good evening to all
Lambiv
multiple choice question
Aster Reply
appreciation
Eliyee
explain perfect market
Lindiwe Reply
In economics, a perfect market refers to a theoretical construct where all participants have perfect information, goods are homogenous, there are no barriers to entry or exit, and prices are determined solely by supply and demand. It's an idealized model used for analysis,
Ezea
What is ceteris paribus?
Shukri Reply
other things being equal
AI-Robot
When MP₁ becomes negative, TP start to decline. Extuples Suppose that the short-run production function of certain cut-flower firm is given by: Q=4KL-0.6K2 - 0.112 • Where is quantity of cut flower produced, I is labour input and K is fixed capital input (K-5). Determine the average product of lab
Kelo
Extuples Suppose that the short-run production function of certain cut-flower firm is given by: Q=4KL-0.6K2 - 0.112 • Where is quantity of cut flower produced, I is labour input and K is fixed capital input (K-5). Determine the average product of labour (APL) and marginal product of labour (MPL)
Kelo
yes,thank you
Shukri
Can I ask you other question?
Shukri
what is monopoly mean?
Habtamu Reply
What is different between quantity demand and demand?
Shukri Reply
Quantity demanded refers to the specific amount of a good or service that consumers are willing and able to purchase at a give price and within a specific time period. Demand, on the other hand, is a broader concept that encompasses the entire relationship between price and quantity demanded
Ezea
ok
Shukri
how do you save a country economic situation when it's falling apart
Lilia Reply
what is the difference between economic growth and development
Fiker Reply
Economic growth as an increase in the production and consumption of goods and services within an economy.but Economic development as a broader concept that encompasses not only economic growth but also social & human well being.
Shukri
production function means
Jabir
What do you think is more important to focus on when considering inequality ?
Abdisa Reply
any question about economics?
Awais Reply
sir...I just want to ask one question... Define the term contract curve? if you are free please help me to find this answer 🙏
Asui
it is a curve that we get after connecting the pareto optimal combinations of two consumers after their mutually beneficial trade offs
Awais
thank you so much 👍 sir
Asui
In economics, the contract curve refers to the set of points in an Edgeworth box diagram where both parties involved in a trade cannot be made better off without making one of them worse off. It represents the Pareto efficient allocations of goods between two individuals or entities, where neither p
Cornelius
In economics, the contract curve refers to the set of points in an Edgeworth box diagram where both parties involved in a trade cannot be made better off without making one of them worse off. It represents the Pareto efficient allocations of goods between two individuals or entities,
Cornelius
Suppose a consumer consuming two commodities X and Y has The following utility function u=X0.4 Y0.6. If the price of the X and Y are 2 and 3 respectively and income Constraint is birr 50. A,Calculate quantities of x and y which maximize utility. B,Calculate value of Lagrange multiplier. C,Calculate quantities of X and Y consumed with a given price. D,alculate optimum level of output .
Feyisa Reply
Answer
Feyisa
c
Jabir
the market for lemon has 10 potential consumers, each having an individual demand curve p=101-10Qi, where p is price in dollar's per cup and Qi is the number of cups demanded per week by the i th consumer.Find the market demand curve using algebra. Draw an individual demand curve and the market dema
Gsbwnw Reply
suppose the production function is given by ( L, K)=L¼K¾.assuming capital is fixed find APL and MPL. consider the following short run production function:Q=6L²-0.4L³ a) find the value of L that maximizes output b)find the value of L that maximizes marginal product
Abdureman
types of unemployment
Yomi Reply
What is the difference between perfect competition and monopolistic competition?
Mohammed

Get Jobilize Job Search Mobile App in your pocket Now!

Get it on Google Play Download on the App Store Now


Source:  OpenStax, Principles of economics. OpenStax CNX. Sep 19, 2014 Download for free at http://legacy.cnx.org/content/col11613/1.11
Google Play and the Google Play logo are trademarks of Google Inc.

Notification Switch

Would you like to follow the 'Principles of economics' conversation and receive update notifications?

Ask