<< Chapter < Page Chapter >> Page >
By the end of this section, you will be able to:
  • Contrast consumer surplus, producer surplus, and social surplus
  • Explain why price floors and price ceilings can be inefficient
  • Analyze demand and supply as a social adjustment mechanism

The familiar demand and supply diagram holds within it the concept of economic efficiency. One typical way that economists define efficiency is when it is impossible to improve the situation of one party without imposing a cost on another. Conversely, if a situation is inefficient, it becomes possible to benefit at least one party without imposing costs on others.

Efficiency in the demand and supply model has the same basic meaning: The economy is getting as much benefit as possible from its scarce resources and all the possible gains from trade have been achieved. In other words, the optimal amount of each good and service is being produced and consumed.

Consumer surplus, producer surplus, social surplus

Consider a market for tablet computers, as shown in [link] . The equilibrium price is $80 and the equilibrium quantity is 28 million. To see the benefits to consumers, look at the segment of the demand curve above the equilibrium    point and to the left. This portion of the demand curve shows that at least some demanders would have been willing to pay more than $80 for a tablet.

For example, point J shows that if the price was $90, 20 million tablets would be sold. Those consumers who would have been willing to pay $90 for a tablet based on the utility they expect to receive from it, but who were able to pay the equilibrium price of $80, clearly received a benefit beyond what they had to pay for. Remember, the demand curve traces consumers’ willingness to pay for different quantities. The amount that individuals would have been willing to pay, minus the amount that they actually paid, is called consumer surplus    . Consumer surplus is the area labeled F—that is, the area above the market price and below the demand curve.

Consumer and producer surplus

The graph shows consumer surplus above the equilibrium and producer surplus beneath the equilibrium.
The somewhat triangular area labeled by F shows the area of consumer surplus, which shows that the equilibrium price in the market was less than what many of the consumers were willing to pay. Point J on the demand curve shows that, even at the price of $90, consumers would have been willing to purchase a quantity of 20 million. The somewhat triangular area labeled by G shows the area of producer surplus, which shows that the equilibrium price received in the market was more than what many of the producers were willing to accept for their products. For example, point K on the supply curve shows that at a price of $45, firms would have been willing to supply a quantity of 14 million.

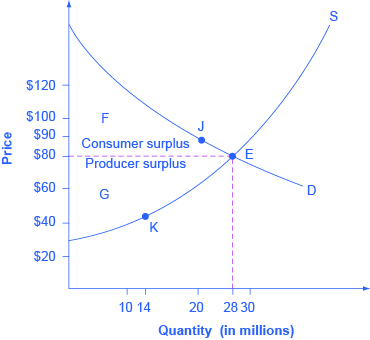
The supply curve shows the quantity that firms are willing to supply at each price. For example, point K in [link] illustrates that, at $45, firms would still have been willing to supply a quantity of 14 million. Those producers who would have been willing to supply the tablets at $45, but who were instead able to charge the equilibrium price of $80, clearly received an extra benefit beyond what they required to supply the product. The amount that a seller is paid for a good minus the seller’s actual cost is called producer surplus    . In [link] , producer surplus is the area labeled G—that is, the area between the market price and the segment of the supply curve below the equilibrium.

Questions & Answers

Why is b in the answer
Dahsolar Reply
how do you work it out?
Brad Reply
answer
Ernest
heheheehe
Nitin
(Pcos∅+qsin∅)/(pcos∅-psin∅)
John Reply
how to do that?
Rosemary Reply
what is it about?
Amoah
how to answer the activity
Chabelita Reply
how to solve the activity
Chabelita
solve for X,,4^X-6(2^)-16=0
Alieu Reply
x4xminus 2
Lominate
sobhan Singh jina uniwarcity tignomatry ka long answers tile questions
harish Reply
t he silly nut company makes two mixtures of nuts: mixture a and mixture b. a pound of mixture a contains 12 oz of peanuts, 3 oz of almonds and 1 oz of cashews and sells for $4. a pound of mixture b contains 12 oz of peanuts, 2 oz of almonds and 2 oz of cashews and sells for $5. the company has 1080
ZAHRO Reply
If  , , are the roots of the equation 3 2 0, x px qx r     Find the value of 1  .
Swetha Reply
Parts of a pole were painted red, blue and yellow. 3/5 of the pole was red and 7/8 was painted blue. What part was painted yellow?
Patrick Reply
Parts of the pole was painted red, blue and yellow. 3 /5 of the pole was red and 7 /8 was painted blue. What part was painted yellow?
Patrick
how I can simplify algebraic expressions
Katleho Reply
Lairene and Mae are joking that their combined ages equal Sam’s age. If Lairene is twice Mae’s age and Sam is 69 yrs old, what are Lairene’s and Mae’s ages?
Mary Reply
23yrs
Yeboah
lairenea's age is 23yrs
ACKA
hy
Katleho
Ello everyone
Katleho
Laurene is 46 yrs and Mae is 23 is
Solomon
hey people
christopher
age does not matter
christopher
solve for X, 4^x-6(2*)-16=0
Alieu
prove`x^3-3x-2cosA=0 (-π<A<=π
Mayank Reply
create a lesson plan about this lesson
Rose Reply
Excusme but what are you wrot?
Got questions? Join the online conversation and get instant answers!
Jobilize.com Reply

Get Jobilize Job Search Mobile App in your pocket Now!

Get it on Google Play Download on the App Store Now


Source:  OpenStax, Principles of economics. OpenStax CNX. Sep 19, 2014 Download for free at http://legacy.cnx.org/content/col11613/1.11
Google Play and the Google Play logo are trademarks of Google Inc.

Notification Switch

Would you like to follow the 'Principles of economics' conversation and receive update notifications?

Ask