<< Chapter < Page Chapter >> Page >
By the end of this section, you will be able to:
  • Explain the Phillips curve, noting its impact on the theories of Keynesian economics
  • Graph a Phillips curve
  • Identify factors that cause the instability of the Phillips curve
  • Analyze the Keynesian policy for reducing unemployment and inflation

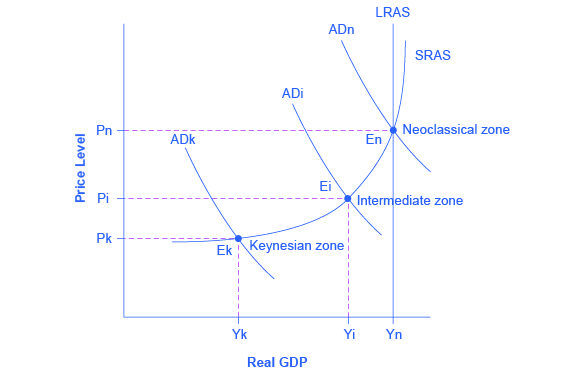
The simplified AD/AS model that we have used so far is fully consistent with Keynes’s original model. More recent research, though, has indicated that in the real world, an aggregate supply curve is more curved than the right angle used in this chapter. Rather, the real-world AS curve is very flat at levels of output far below potential (“the Keynesian zone”), very steep at levels of output above potential (“the neoclassical zone”) and curved in between (“the intermediate zone”). This is illustrated in [link] . The typical aggregate supply curve leads to the concept of the Phillips curve.

Keynes, neoclassical, and intermediate zones in the aggregate supply curve

The graph shows three aggregate demand curves to represent different zones: the Keynesian zone, the intermediate zone, and the neoclassical zone. The Keynesian zone is farthest to the left as well as the lowest; the intermediate zone is the center of the three curves; the neoclassical is farthest to the right as well as the highest.
Near the equilibrium Ek, in the Keynesian zone at the far left of the SRAS curve, small shifts in AD, either to the right or the left, will affect the output level Yk, but will not much affect the price level. In the Keynesian zone, AD largely determines the quantity of output. Near the equilibrium En, in the neoclassical zone, at the far right of the SRAS curve, small shifts in AD, either to the right or the left, will have relatively little effect on the output level Yn, but instead will have a greater effect on the price level. In the neoclassical zone, the near-vertical SRAS curve close to the level of potential GDP (as represented by the LRAS line) largely determines the quantity of output. In the intermediate zone around equilibrium Ei, movement in AD to the right will increase both the output level and the price level, while a movement in AD to the left would decrease both the output level and the price level.

The discovery of the phillips curve

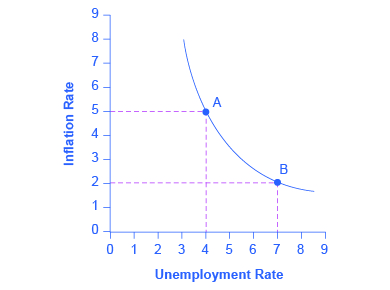
In the 1950s, A.W. Phillips , an economist at the London School of Economics, was studying the Keynesian analytical framework. The Keynesian theory implied that during a recession inflationary pressures are low, but when the level of output is at or even pushing beyond potential GDP, the economy is at greater risk for inflation. Phillips analyzed 60 years of British data and did find that tradeoff between unemployment and inflation, which became known as a Phillips curve    . [link] shows a theoretical Phillips curve, and the following Work It Out feature shows how the pattern appears for the United States.

A keynesian phillips curve tradeoff between unemployment and inflation

The graph provides a visual representation of the Phillips curve with a downward-sloping curve.
A Phillips curve illustrates a tradeoff between the unemployment rate and the inflation rate; if one is higher, the other must be lower. For example, point A illustrates an inflation rate of 5% and an unemployment rate of 4%. If the government attempts to reduce inflation to 2%, then it will experience a rise in unemployment to 7%, as shown at point B.

The phillips curve for the united states

Step 1. Go to this website to see the 2005 Economic Report of the President.

Step 2. Scroll down and locate Table B-63 in the Appendices. This table is titled “Changes in special consumer price indexes, 1960–2004.”

Step 3. Download the table in Excel by selecting the XLS option and then selecting the location in which to save the file.

Step 4. Open the downloaded Excel file.

Step 5. View the third column (labeled “Year to year”). This is the inflation rate, measured by the percentage change in the Consumer Price Index.

Step 6. Return to the website and scroll to locate the Appendix Table B-42 “Civilian unemployment rate, 1959–2004.

Step 7. Download the table in Excel.

Step 8. Open the downloaded Excel file and view the second column. This is the overall unemployment rate.

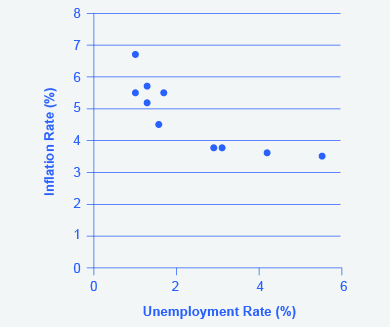
Step 9. Using the data available from these two tables, plot the Phillips curve for 1960–69, with unemployment rate on the x-axis and the inflation rate on the y-axis. Your graph should look like [link] .

The phillips curve from 1960–1969

The Phillips Curve shows a clear negative relationship between the unemployment rate and the inflation rate over the period 1960-69.
This chart shows the negative relationship between unemployment and inflation.

Step 10. Plot the Phillips curve for 1960–1979. What does the graph look like? Do you still see the tradeoff between inflation and unemployment? Your graph should look like [link] .

U.s. phillips curve, 1960–1979

The tradeoff between unemployment and inflation appeared to break down during the 1970s as the Phillips Curve shifted out to the right, meaning a given unemployment rate corresponds to a variety of rates of inflation and vice versa.
The tradeoff between unemployment and inflation appeared to break down during the 1970s as the Phillips Curve shifted out to the right.

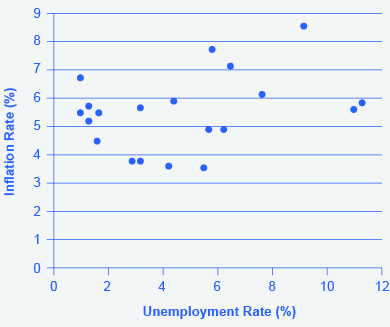
Over this longer period of time, the Phillips curve appears to have shifted out. There is no tradeoff any more.

Questions & Answers

how did you get 1640
Noor Reply
If auger is pair are the roots of equation x2+5x-3=0
Peter Reply
Wayne and Dennis like to ride the bike path from Riverside Park to the beach. Dennis’s speed is seven miles per hour faster than Wayne’s speed, so it takes Wayne 2 hours to ride to the beach while it takes Dennis 1.5 hours for the ride. Find the speed of both bikers.
MATTHEW Reply
420
Sharon
from theory: distance [miles] = speed [mph] × time [hours] info #1 speed_Dennis × 1.5 = speed_Wayne × 2 => speed_Wayne = 0.75 × speed_Dennis (i) info #2 speed_Dennis = speed_Wayne + 7 [mph] (ii) use (i) in (ii) => [...] speed_Dennis = 28 mph speed_Wayne = 21 mph
George
Let W be Wayne's speed in miles per hour and D be Dennis's speed in miles per hour. We know that W + 7 = D and W * 2 = D * 1.5. Substituting the first equation into the second: W * 2 = (W + 7) * 1.5 W * 2 = W * 1.5 + 7 * 1.5 0.5 * W = 7 * 1.5 W = 7 * 3 or 21 W is 21 D = W + 7 D = 21 + 7 D = 28
Salma
Devon is 32 32​​ years older than his son, Milan. The sum of both their ages is 54 54​. Using the variables d d​ and m m​ to represent the ages of Devon and Milan, respectively, write a system of equations to describe this situation. Enter the equations below, separated by a comma.
Aaron Reply
find product (-6m+6) ( 3m²+4m-3)
SIMRAN Reply
-42m²+60m-18
Salma
what is the solution
bill
how did you arrive at this answer?
bill
-24m+3+3mÁ^2
Susan
i really want to learn
Amira
I only got 42 the rest i don't know how to solve it. Please i need help from anyone to help me improve my solving mathematics please
Amira
Hw did u arrive to this answer.
Aphelele
hi
Bajemah
-6m(3mA²+4m-3)+6(3mA²+4m-3) =-18m²A²-24m²+18m+18mA²+24m-18 Rearrange like items -18m²A²-24m²+42m+18A²-18
Salma
complete the table of valuesfor each given equatio then graph. 1.x+2y=3
Jovelyn Reply
x=3-2y
Salma
y=x+3/2
Salma
Hi
Enock
given that (7x-5):(2+4x)=8:7find the value of x
Nandala
3x-12y=18
Kelvin
please why isn't that the 0is in ten thousand place
Grace Reply
please why is it that the 0is in the place of ten thousand
Grace
Send the example to me here and let me see
Stephen
A meditation garden is in the shape of a right triangle, with one leg 7 feet. The length of the hypotenuse is one more than the length of one of the other legs. Find the lengths of the hypotenuse and the other leg
Marry Reply
how far
Abubakar
cool u
Enock
state in which quadrant or on which axis each of the following angles given measure. in standard position would lie 89°
Abegail Reply
hello
BenJay
hi
Method
I am eliacin, I need your help in maths
Rood
how can I help
Sir
hmm can we speak here?
Amoon
however, may I ask you some questions about Algarba?
Amoon
hi
Enock
what the last part of the problem mean?
Roger
The Jones family took a 15 mile canoe ride down the Indian River in three hours. After lunch, the return trip back up the river took five hours. Find the rate, in mph, of the canoe in still water and the rate of the current.
cameron Reply
Shakir works at a computer store. His weekly pay will be either a fixed amount, $925, or $500 plus 12% of his total sales. How much should his total sales be for his variable pay option to exceed the fixed amount of $925.
mahnoor Reply
I'm guessing, but it's somewhere around $4335.00 I think
Lewis
12% of sales will need to exceed 925 - 500, or 425 to exceed fixed amount option. What amount of sales does that equal? 425 ÷ (12÷100) = 3541.67. So the answer is sales greater than 3541.67. Check: Sales = 3542 Commission 12%=425.04 Pay = 500 + 425.04 = 925.04. 925.04 > 925.00
Munster
difference between rational and irrational numbers
Arundhati Reply
When traveling to Great Britain, Bethany exchanged $602 US dollars into £515 British pounds. How many pounds did she receive for each US dollar?
Jakoiya Reply
how to reduced echelon form
Solomon Reply
Jazmine trained for 3 hours on Saturday. She ran 8 miles and then biked 24 miles. Her biking speed is 4 mph faster than her running speed. What is her running speed?
Zack Reply
d=r×t the equation would be 8/r+24/r+4=3 worked out
Sheirtina
Got questions? Join the online conversation and get instant answers!
Jobilize.com Reply

Get Jobilize Job Search Mobile App in your pocket Now!

Get it on Google Play Download on the App Store Now


Source:  OpenStax, Principles of economics. OpenStax CNX. Sep 19, 2014 Download for free at http://legacy.cnx.org/content/col11613/1.11
Google Play and the Google Play logo are trademarks of Google Inc.

Notification Switch

Would you like to follow the 'Principles of economics' conversation and receive update notifications?

Ask