

| << Chapter < Page | Chapter >> Page > |
These two Keynesian assumptions—the importance of aggregate demand in causing recession and the stickiness of wages and prices—are illustrated by the AD/AS diagram in [link] . Note that because of the stickiness of wages and prices, the aggregate supply curve is flatter than either supply curve (labor or specific good). In fact, if wages and prices were so sticky that they did not fall at all, the aggregate supply curve would be completely flat below potential GDP, as shown in [link] . This outcome is an important example of a macroeconomic externality , where what happens at the macro level is different from and inferior to what happens at the micro level. For example, a firm should respond to a decrease in demand for its product by cutting its price to increase sales. But if all firms experience a decrease in demand for their products, sticky prices in the aggregate prevent aggregate demand from rebounding (which would be shown as a movement along the AD curve in response to a lower price level).
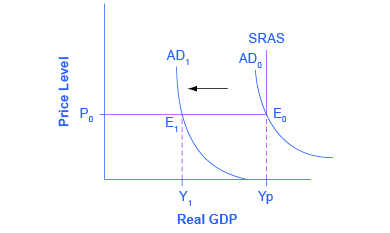
The original equilibrium of this economy occurs where the aggregate demand function (AD 0 ) intersects with AS. Since this intersection occurs at potential GDP (Yp), the economy is operating at full employment. When aggregate demand shifts to the left, all the adjustment occurs through decreased real GDP. There is no decrease in the price level. Since the equilibrium occurs at Y 1 , the economy experiences substantial unemployment.
A key concept in Keynesian economics is the expenditure multiplier . The expenditure multiplier is the idea that not only does spending affect the equilibrium level of GDP, but that spending is powerful. More precisely, it means that a change in spending causes a more than proportionate change in GDP.
The reason for the expenditure multiplier is that one person’s spending becomes another person’s income, which leads to additional spending and additional income, and so forth, so that the cumulative impact on GDP is larger than the initial increase in spending. The details of the multiplier process are provided in the appendix on The Expenditure-Output Model , but the concept is important enough to be summarized here. While the multiplier is important for understanding the effectiveness of fiscal policy, it occurs whenever any autonomous increase in spending occurs. Additionally, the multiplier operates in a negative as well as a positive direction. Thus, when investment spending collapsed during the Great Depression, it caused a much larger decrease in real GDP. The size of the multiplier is critical and was a key element in recent discussions of the effectiveness of the Obama administration’s fiscal stimulus package, officially titled the American Recovery and Reinvestment Act of 2009 .
Keynesian economics is based on two main ideas: (1) aggregate demand is more likely than aggregate supply to be the primary cause of a short-run economic event like a recession; (2) wages and prices can be sticky, and so, in an economic downturn, unemployment can result. The latter is an example of a macroeconomic externality. While surpluses cause prices to fall at the micro level, they do not necessarily at the macro level; instead the adjustment to a decrease in demand occurs only through decreased quantities. One reason why prices may be sticky is menu costs, the costs of changing prices. These include internal costs a business faces in changing prices in terms of labeling, recordkeeping, and accounting, and also the costs of communicating the price change to (possibly unhappy) customers. Keynesians also believe in the existence of the expenditure multiplier—the notion that a change in autonomous expenditure causes a more than proportionate change in GDP.
Harford, Tim. “What Price Supply and Demand?” http://timharford.com/2014/01/what-price-supply-and-demand/?utm_source=dlvr.it&utm_medium=twitter.
National Employment Law Project. “Job Creation and Economic Recovery.” http://www.nelp.org/index.php/content/content_issues/category/job_creation_and_economic_recovery/.
Notification Switch
Would you like to follow the 'Principles of economics' conversation and receive update notifications?

|
|
|
|
|

|
|

|
|

|
|

|
|

|
|

|
|

|
|

|
|
|
|
|

|