<< Chapter < Page Chapter >> Page >

An increase in the price of some product signals consumers that there is a shortage and the product should perhaps be economized on. For example, if you are thinking about taking a plane trip to Hawaii, but the ticket turns out to be expensive during the week you intend to go, you might consider other weeks when the ticket might be cheaper. The price could be high because you were planning to travel during a holiday when demand for traveling is high. Or, maybe the cost of an input like jet fuel increased or the airline has raised the price temporarily to see how many people are willing to pay it. Perhaps all of these factors are present at the same time. You do not need to analyze the market and break down the price change into its underlying factors. You just have to look at the price of a ticket and decide whether and when to fly.

In the same way, price changes provide useful information to producers. Imagine the situation of a farmer who grows oats and learns that the price of oats has risen. The higher price could be due to an increase in demand caused by a new scientific study proclaiming that eating oats is especially healthful. Or perhaps the price of a substitute grain, like corn, has risen, and people have responded by buying more oats. But the oat farmer does not need to know the details. The farmer only needs to know that the price of oats has risen and that it will be profitable to expand production as a result.

The actions of individual consumers and producers as they react to prices overlap and interlock in markets for goods, labor, and financial capital. A change in any single market is transmitted through these multiple interconnections to other markets. The vision of the role of flexible prices helping markets to reach equilibrium and linking different markets together helps to explain why price controls can be so counterproductive. Price controls are government laws that serve to regulate prices rather than allow the various markets to determine prices. There is an old proverb: “Don’t kill the messenger.” In ancient times, messengers carried information between distant cities and kingdoms. When they brought bad news, there was an emotional impulse to kill the messenger. But killing the messenger did not kill the bad news. Moreover, killing the messenger had an undesirable side effect: Other messengers would refuse to bring news to that city or kingdom, depriving its citizens of vital information.

Those who seek price controls are trying to kill the messenger—or at least to stifle an unwelcome message that prices are bringing about the equilibrium level of price and quantity. But price controls do nothing to affect the underlying forces of demand and supply, and this can have serious repercussions. During China’s “Great Leap Forward” in the late 1950s, food prices were kept artificially low, with the result that 30 to 40 million people died of starvation because the low prices depressed farm production. Changes in demand and supply will continue to reveal themselves through consumers’ and producers’ behavior. Immobilizing the price messenger through price controls will deprive everyone in the economy of critical information. Without this information, it becomes difficult for everyone—buyers and sellers alike—to react in a flexible and appropriate manner as changes occur throughout the economy.

Baby boomers come of age

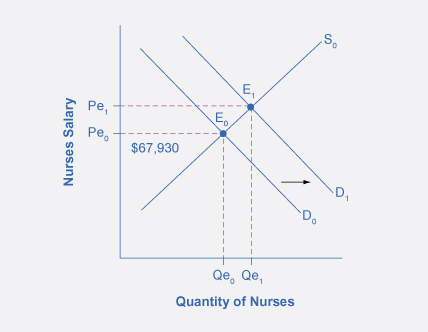
The theory of supply and demand can explain what happens in the labor markets and suggests that the demand for nurses will increase as healthcare needs of baby boomers increase, as [link] shows. The impact of that increase will result in an average salary higher than the $67,930 earned in 2012 referenced in the first part of this case. The new equilibrium (E 1 ) will be at the new equilibrium price (Pe 1 ).Equilibrium quantity will also increase from Qe 0 to Qe 1 .

Impact of increasing demand for nurses 2012-2022

The graph shows an increase in the demand for and nurses from D0 to D1.
In 2012, the median salary for nurses was $67,930. As demand for services increases, the demand curve shifts to the right (from D 0 to D 1 ) and the equilibrium quantity of nurses increases from Qe 0 to Qe 1 . The equilibrium salary increases from Pe 0 to Pe 1 .

Suppose that as the demand for nurses increases, the supply shrinks due to an increasing number of nurses entering retirement and increases in the tuition of nursing degrees. The impact of a decreasing supply of nurses is captured by the leftward shift of the supply curve in [link] The shifts in the two curves result in higher salaries for nurses, but the overall impact in the quantity of nurses is uncertain, as it depends on the relative shifts of supply and demand.

Impact of decreasing supply of nurses between 2012 and 2022

The graph shows increases in both the supply and demand for nurses and its effect on equilibrium price and quantity
Initially, salaries increase as demand for nursing increases to Pe 1 . When demand increases, so too does the equilibrium quantity, from Qe 0 to Qe 1 . The decrease in the supply of nurses due to nurses retiring from the workforce and fewer nursing graduates ( ceterus paribus ), causes a leftward shift of the supply curve resulting in even higher salaries for nurses, at Pe 2 , but an uncertain outcome for the equilibrium quantity of nurses, which in this representation is less than Qe 1 , but more than the initial Qe 0 .

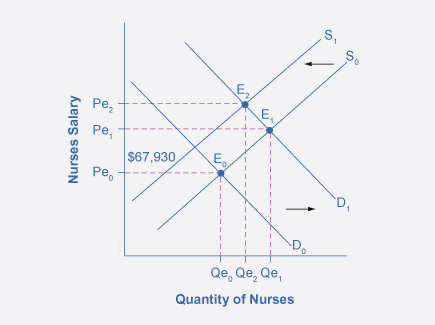
While we do not know if the number of nurses will increase or decrease relative to their initial employment, we know they will have higher salaries. The situation of the labor market for nurses described in the beginning of the chapter is different from this example, because instead of a shrinking supply, we had the supply growing at a lower rate than the growth in demand. Since both curves were shifting to the right, we would have an unequivocal increase in the quantity of nurses. And because the shift in the demand curve was larger than the one in the supply, we would expect higher wages as a result.

Key concepts and summary

The market price system provides a highly efficient mechanism for disseminating information about relative scarcities of goods, services, labor, and financial capital. Market participants do not need to know why prices have changed, only that the changes require them to revisit previous decisions they made about supply and demand. Price controls hide information about the true scarcity of products and thereby cause misallocation of resources.

Problems

Imagine that to preserve the traditional way of life in small fishing villages, a government decides to impose a price floor that will guarantee all fishermen a certain price for their catch.

  1. Using the demand and supply framework, predict the effects on the price, quantity demanded, and quantity supplied.
  2. With the enactment of this price floor for fish, what are some of the likely unintended consequences in the market?
  3. Suggest some policies other than the price floor to make it possible for small fishing villages to continue.
Got questions? Get instant answers now!

What happens to the price and the quantity bought and sold in the cocoa market if countries producing cocoa experience a drought and a new study is released demonstrating the health benefits of cocoa? Illustrate your answer with a demand and supply graph.

Got questions? Get instant answers now!

Questions & Answers

differentiate between demand and supply giving examples
Lambiv Reply
differentiated between demand and supply using examples
Lambiv
what is labour ?
Lambiv
how will I do?
Venny Reply
how is the graph works?I don't fully understand
Rezat Reply
information
Eliyee
devaluation
Eliyee
t
WARKISA
hi guys good evening to all
Lambiv
multiple choice question
Aster Reply
appreciation
Eliyee
explain perfect market
Lindiwe Reply
In economics, a perfect market refers to a theoretical construct where all participants have perfect information, goods are homogenous, there are no barriers to entry or exit, and prices are determined solely by supply and demand. It's an idealized model used for analysis,
Ezea
What is ceteris paribus?
Shukri Reply
other things being equal
AI-Robot
When MP₁ becomes negative, TP start to decline. Extuples Suppose that the short-run production function of certain cut-flower firm is given by: Q=4KL-0.6K2 - 0.112 • Where is quantity of cut flower produced, I is labour input and K is fixed capital input (K-5). Determine the average product of lab
Kelo
Extuples Suppose that the short-run production function of certain cut-flower firm is given by: Q=4KL-0.6K2 - 0.112 • Where is quantity of cut flower produced, I is labour input and K is fixed capital input (K-5). Determine the average product of labour (APL) and marginal product of labour (MPL)
Kelo
yes,thank you
Shukri
Can I ask you other question?
Shukri
what is monopoly mean?
Habtamu Reply
What is different between quantity demand and demand?
Shukri Reply
Quantity demanded refers to the specific amount of a good or service that consumers are willing and able to purchase at a give price and within a specific time period. Demand, on the other hand, is a broader concept that encompasses the entire relationship between price and quantity demanded
Ezea
ok
Shukri
how do you save a country economic situation when it's falling apart
Lilia Reply
what is the difference between economic growth and development
Fiker Reply
Economic growth as an increase in the production and consumption of goods and services within an economy.but Economic development as a broader concept that encompasses not only economic growth but also social & human well being.
Shukri
production function means
Jabir
What do you think is more important to focus on when considering inequality ?
Abdisa Reply
any question about economics?
Awais Reply
sir...I just want to ask one question... Define the term contract curve? if you are free please help me to find this answer 🙏
Asui
it is a curve that we get after connecting the pareto optimal combinations of two consumers after their mutually beneficial trade offs
Awais
thank you so much 👍 sir
Asui
In economics, the contract curve refers to the set of points in an Edgeworth box diagram where both parties involved in a trade cannot be made better off without making one of them worse off. It represents the Pareto efficient allocations of goods between two individuals or entities, where neither p
Cornelius
In economics, the contract curve refers to the set of points in an Edgeworth box diagram where both parties involved in a trade cannot be made better off without making one of them worse off. It represents the Pareto efficient allocations of goods between two individuals or entities,
Cornelius
Suppose a consumer consuming two commodities X and Y has The following utility function u=X0.4 Y0.6. If the price of the X and Y are 2 and 3 respectively and income Constraint is birr 50. A,Calculate quantities of x and y which maximize utility. B,Calculate value of Lagrange multiplier. C,Calculate quantities of X and Y consumed with a given price. D,alculate optimum level of output .
Feyisa Reply
Answer
Feyisa
c
Jabir
the market for lemon has 10 potential consumers, each having an individual demand curve p=101-10Qi, where p is price in dollar's per cup and Qi is the number of cups demanded per week by the i th consumer.Find the market demand curve using algebra. Draw an individual demand curve and the market dema
Gsbwnw Reply
suppose the production function is given by ( L, K)=L¼K¾.assuming capital is fixed find APL and MPL. consider the following short run production function:Q=6L²-0.4L³ a) find the value of L that maximizes output b)find the value of L that maximizes marginal product
Abdureman
types of unemployment
Yomi Reply
What is the difference between perfect competition and monopolistic competition?
Mohammed
Got questions? Join the online conversation and get instant answers!
Jobilize.com Reply

Get Jobilize Job Search Mobile App in your pocket Now!

Get it on Google Play Download on the App Store Now


Source:  OpenStax, Principles of macroeconomics for ap® courses. OpenStax CNX. Aug 24, 2015 Download for free at http://legacy.cnx.org/content/col11864/1.2
Google Play and the Google Play logo are trademarks of Google Inc.

Notification Switch

Would you like to follow the 'Principles of macroeconomics for ap® courses' conversation and receive update notifications?

Ask