| << Chapter < Page | Chapter >> Page > |

U.S. presidential candidates often run for office pledging to improve the public schools or to get tough on crime. However, in the U.S. system of government, these tasks are primarily the responsibilities of state and local governments. Indeed, in fiscal year 2014 state and local governments spent about $840 billion per year on education (including K–12 and college and university education), compared to only $100 billion by the federal government, according to usgovernmentspending.com. In other words, about 90 cents of every dollar spent on education happens at the state and local level. A politician who really wants hands-on responsibility for reforming education or reducing crime might do better to run for mayor of a large city or for state governor rather than for president of the United States.
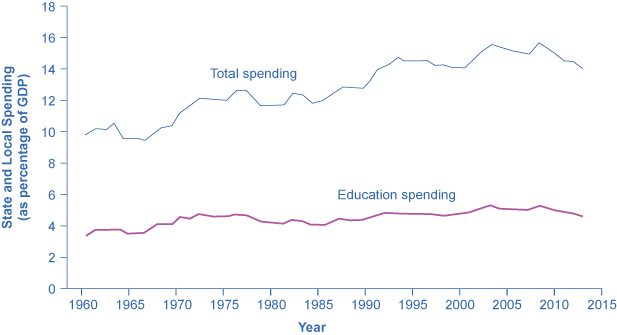
Fiscal policy is the set of policies that relate to federal government spending, taxation, and borrowing. In recent decades, the level of federal government spending and taxes, expressed as a share of GDP, has not changed much, typically fluctuating between about 18% to 22% of GDP. However, the level of state spending and taxes, as a share of GDP, has risen from about 12–13% to about 20% of GDP over the last four decades. The four main areas of federal spending are national defense, Social Security, healthcare, and interest payments, which together account for about 70% of all federal spending. When a government spends more than it collects in taxes, it is said to have a budget deficit. When a government collects more in taxes than it spends, it is said to have a budget surplus. If government spending and taxes are equal, it is said to have a balanced budget. The sum of all past deficits and surpluses make up the government debt.
A government starts off with a total debt of $3.5 billion. In year one, the government runs a deficit of $400 million. In year two, the government runs a deficit of $1 billion. In year three, the government runs a surplus of $200 million. What is the total debt of the government at the end of year three?
Kramer, Mattea, et. al. A People's Guide to the Federal Budget. National Priorities Project. Northampton: Interlink Books, 2012.
Kurtzleben, Danielle. “10 States With The Largest Budget Shortfalls.” U.S. News&World Report . Januray 14, 2011. http://www.usnews.com/news/articles/2011/01/14/10-states-with-the-largest-budget-shortfalls.
Miller, Rich, and William Selway. “U.S. Cities and States Start Spending Again.” BloombergBusinessweek , January 10, 2013. http://www.businessweek.com/articles/2013-01-10/u-dot-s-dot-cities-and-states-start-spending-again.
Weisman, Jonathan. “After Year of Working Around Federal Cuts, Agencies Face Fewer Options.” The New York Times , October 26, 2013. http://www.nytimes.com/2013/10/27/us/politics/after-year-of-working-around-federal-cuts-agencies-face-fewer-options.html?_r=0.
Chantrill, Christopher. USGovernmentSpending.com. “Government Spending Details: United States Federal State and Local Government Spending, Fiscal Year 2013.” http://www.usgovernmentspending.com/year_spending_2013USbn_15bs2n_20.

Notification Switch
Would you like to follow the 'Principles of macroeconomics for ap® courses' conversation and receive update notifications?