<< Chapter < Page Chapter >> Page >
By the end of this section, you will be able to:
  • Explain how productivity growth changes the aggregate supply curve
  • Explain how changes in input prices changes the aggregate supply curve

The original equilibrium in the AD/AS diagram will shift to a new equilibrium if the AS or AD curve shifts. When the aggregate supply curve shifts to the right, then at every price level, a greater quantity of real GDP is produced. When the SRAS curve shifts to the left, then at every price level, a lower quantity of real GDP is produced. This module discusses two of the most important factors that can lead to shifts in the AS curve: productivity growth and input prices.

How productivity growth shifts the as curve

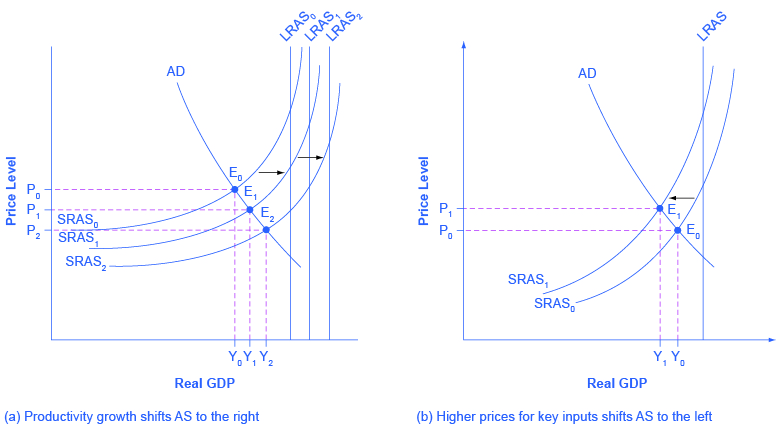
In the long run, the most important factor shifting the AS curve is productivity growth . Productivity means how much output can be produced with a given quantity of labor. One measure of this is output per worker or GDP per capita    . Over time, productivity grows so that the same quantity of labor can produce more output. Historically, the real growth in GDP per capita in an advanced economy like the United States has averaged about 2% to 3% per year, but productivity growth has been faster during certain extended periods like the 1960s and the late 1990s through the early 2000s, or slower during periods like the 1970s. A higher level of productivity shifts the AS curve to the right, because with improved productivity, firms can produce a greater quantity of output at every price level. [link] (a) shows an outward shift in productivity over two time periods. The AS curve shifts out from SRAS 0 to SRAS 1 to SRAS 2 , reflecting the rise in potential GDP in this economy, and the equilibrium shifts from E 0 to E 1 to E 2 .

Shifts in aggregate supply

The two graphs show how aggregate supply can shift and how these shifts affect points of equilibrium. The graph on the left shows how productivity increases will shift aggregate supply to the right. The graph on the right shows how higher prices for key inputs will shift aggregate supply to the left.
(a) The rise in productivity causes the SRAS curve to shift to the right. The original equilibrium E 0 is at the intersection of AD and SRAS 0 . When SRAS shifts right, then the new equilibrium E 1 is at the intersection of AD and SRAS 1 , and then yet another equilibrium, E 2 , is at the intersection of AD and SRAS 2 . Shifts in SRAS to the right, lead to a greater level of output and to downward pressure on the price level. (b) A higher price for inputs means that at any given price level for outputs, a lower quantity will be produced so aggregate supply will shift to the left from SRAS 0 to AS 1 . The new equilibrium, E 1 , has a reduced quantity of output and a higher price level than the original equilibrium (E 0 ).

A shift in the SRAS curve to the right will result in a greater real GDP and downward pressure on the price level, if aggregate demand remains unchanged. However, if this shift in SRAS results from gains in productivity growth, which are typically measured in terms of a few percentage points per year, the effect will be relatively small over a few months or even a couple of years.

How changes in input prices shift the as curve

Higher prices for inputs that are widely used across the entire economy can have a macroeconomic impact on aggregate supply. Examples of such widely used inputs include wages and energy products. Increases in the price of such inputs will cause the SRAS curve to shift to the left, which means that at each given price level for outputs, a higher price for inputs will discourage production because it will reduce the possibilities for earning profits. [link] (b) shows the aggregate supply curve shifting to the left, from SRAS 0 to SRAS 1 , causing the equilibrium to move from E 0 to E 1 . The movement from the original equilibrium of E 0 to the new equilibrium of E 1 will bring a nasty set of effects: reduced GDP or recession, higher unemployment because the economy is now further away from potential GDP, and an inflationary higher price level as well. For example, the U.S. economy experienced recessions in 1974–1975, 1980–1982, 1990–91, 2001, and 2007–2009 that were each preceded or accompanied by a rise in the key input of oil prices. In the 1970s, this pattern of a shift to the left in SRAS leading to a stagnant economy with high unemployment and inflation was nicknamed stagflation    .

Conversely, a decline in the price of a key input like oil will shift the SRAS curve to the right, providing an incentive for more to be produced at every given price level for outputs. From 1985 to 1986, for example, the average price of crude oil fell by almost half, from $24 a barrel to $12 a barrel. Similarly, from 1997 to 1998, the price of a barrel of crude oil dropped from $17 per barrel to $11 per barrel. In both cases, the plummeting price of oil led to a situation like that presented earlier in [link] (a), where the outward shift of SRAS to the right allowed the economy to expand, unemployment to fall, and inflation to decline.

Along with energy prices, two other key inputs that may shift the SRAS curve are the cost of labor, or wages, and the cost of imported goods that are used as inputs for other products. In these cases as well, the lesson is that lower prices for inputs cause SRAS to shift to the right, while higher prices cause it to shift back to the left.

Other supply shocks

The aggregate supply curve can also shift due to shocks to input goods or labor. For example, an unexpected early freeze could destroy a large number of agricultural crops, a shock that would shift the AS curve to the left since there would be fewer agricultural products available at any given price.

Similarly, shocks to the labor market can affect aggregate supply. An extreme example might be an overseas war that required a large number of workers to cease their ordinary production in order to go fight for their country. In this case, aggregate supply would shift to the left because there would be fewer workers available to produce goods at any given price.

Key concepts and summary

The aggregate demand/aggregate supply (AD/AS) diagram shows how AD and AS interact. The intersection of the AD and AS curves shows the equilibrium output and price level in the economy. Movements of either AS or AD will result in a different equilibrium output and price level. The aggregate supply curve will shift out to the right as productivity increases. It will shift back to the left as the price of key inputs rises, and will shift out to the right if the price of key inputs falls. If the AS curve shifts back to the left, the combination of lower output, higher unemployment, and higher inflation, called stagflation, occurs. If AS shifts out to the right, a combination of lower inflation, higher output, and lower unemployment is possible.

Questions & Answers

how did you get 1640
Noor Reply
If auger is pair are the roots of equation x2+5x-3=0
Peter Reply
Wayne and Dennis like to ride the bike path from Riverside Park to the beach. Dennis’s speed is seven miles per hour faster than Wayne’s speed, so it takes Wayne 2 hours to ride to the beach while it takes Dennis 1.5 hours for the ride. Find the speed of both bikers.
MATTHEW Reply
420
Sharon
from theory: distance [miles] = speed [mph] × time [hours] info #1 speed_Dennis × 1.5 = speed_Wayne × 2 => speed_Wayne = 0.75 × speed_Dennis (i) info #2 speed_Dennis = speed_Wayne + 7 [mph] (ii) use (i) in (ii) => [...] speed_Dennis = 28 mph speed_Wayne = 21 mph
George
Let W be Wayne's speed in miles per hour and D be Dennis's speed in miles per hour. We know that W + 7 = D and W * 2 = D * 1.5. Substituting the first equation into the second: W * 2 = (W + 7) * 1.5 W * 2 = W * 1.5 + 7 * 1.5 0.5 * W = 7 * 1.5 W = 7 * 3 or 21 W is 21 D = W + 7 D = 21 + 7 D = 28
Salma
Devon is 32 32​​ years older than his son, Milan. The sum of both their ages is 54 54​. Using the variables d d​ and m m​ to represent the ages of Devon and Milan, respectively, write a system of equations to describe this situation. Enter the equations below, separated by a comma.
Aaron Reply
find product (-6m+6) ( 3m²+4m-3)
SIMRAN Reply
-42m²+60m-18
Salma
what is the solution
bill
how did you arrive at this answer?
bill
-24m+3+3mÁ^2
Susan
i really want to learn
Amira
I only got 42 the rest i don't know how to solve it. Please i need help from anyone to help me improve my solving mathematics please
Amira
Hw did u arrive to this answer.
Aphelele
hi
Bajemah
-6m(3mA²+4m-3)+6(3mA²+4m-3) =-18m²A²-24m²+18m+18mA²+24m-18 Rearrange like items -18m²A²-24m²+42m+18A²-18
Salma
complete the table of valuesfor each given equatio then graph. 1.x+2y=3
Jovelyn Reply
x=3-2y
Salma
y=x+3/2
Salma
Hi
Enock
given that (7x-5):(2+4x)=8:7find the value of x
Nandala
3x-12y=18
Kelvin
please why isn't that the 0is in ten thousand place
Grace Reply
please why is it that the 0is in the place of ten thousand
Grace
Send the example to me here and let me see
Stephen
A meditation garden is in the shape of a right triangle, with one leg 7 feet. The length of the hypotenuse is one more than the length of one of the other legs. Find the lengths of the hypotenuse and the other leg
Marry Reply
how far
Abubakar
cool u
Enock
state in which quadrant or on which axis each of the following angles given measure. in standard position would lie 89°
Abegail Reply
hello
BenJay
hi
Method
I am eliacin, I need your help in maths
Rood
how can I help
Sir
hmm can we speak here?
Amoon
however, may I ask you some questions about Algarba?
Amoon
hi
Enock
what the last part of the problem mean?
Roger
The Jones family took a 15 mile canoe ride down the Indian River in three hours. After lunch, the return trip back up the river took five hours. Find the rate, in mph, of the canoe in still water and the rate of the current.
cameron Reply
Shakir works at a computer store. His weekly pay will be either a fixed amount, $925, or $500 plus 12% of his total sales. How much should his total sales be for his variable pay option to exceed the fixed amount of $925.
mahnoor Reply
I'm guessing, but it's somewhere around $4335.00 I think
Lewis
12% of sales will need to exceed 925 - 500, or 425 to exceed fixed amount option. What amount of sales does that equal? 425 ÷ (12÷100) = 3541.67. So the answer is sales greater than 3541.67. Check: Sales = 3542 Commission 12%=425.04 Pay = 500 + 425.04 = 925.04. 925.04 > 925.00
Munster
difference between rational and irrational numbers
Arundhati Reply
When traveling to Great Britain, Bethany exchanged $602 US dollars into £515 British pounds. How many pounds did she receive for each US dollar?
Jakoiya Reply
how to reduced echelon form
Solomon Reply
Jazmine trained for 3 hours on Saturday. She ran 8 miles and then biked 24 miles. Her biking speed is 4 mph faster than her running speed. What is her running speed?
Zack Reply
d=r×t the equation would be 8/r+24/r+4=3 worked out
Sheirtina
Got questions? Join the online conversation and get instant answers!
Jobilize.com Reply

Get Jobilize Job Search Mobile App in your pocket Now!

Get it on Google Play Download on the App Store Now


Source:  OpenStax, Principles of macroeconomics for ap® courses. OpenStax CNX. Aug 24, 2015 Download for free at http://legacy.cnx.org/content/col11864/1.2
Google Play and the Google Play logo are trademarks of Google Inc.

Notification Switch

Would you like to follow the 'Principles of macroeconomics for ap® courses' conversation and receive update notifications?

Ask