<< Chapter < Page Chapter >> Page >

The coordinates determine distance and direction

A positive number means a direction to the right or up . A negative number means a direction to the left or down .

A point with coordinates negative two, three plotted on rectangular coordinate system with the text message 'This point is located two units to the left of the origin and three units up from the origin.' written in the outer area of the plane.

Plotting points

Since points and ordered pairs are so closely related, the two terms are sometimes used interchangeably. The following two phrases have the same meaning:
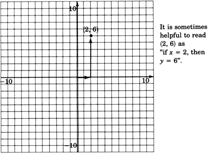
  1. Plot the point ( a , b ) .
  2. Plot the ordered pair ( a , b ) .

Plotting a point

Both phrases mean: Locate, in the plane, the point associated with the ordered pair ( a , b ) and draw a mark at that position.

Sample set a

Plot the ordered pair ( 2 , 6 ) .

We begin at the origin. The first number in the ordered pair, 2, tells us we move 2 units to the right ( + 2 means 2 units to the right) The second number in the ordered pair, 6, tells us we move 6 units up ( + 6 means 6 units up).

An xy coordinate plane from negative ten to ten with increments of one. The graph contains an arrow from the origin to a point two units to the right of the origin and another arrow from the end of the first arrow to a point six units above. The coordinate of the point where the second arrow ends are two, six. There is a text message with the graph saying, 'It is sometimes helpful to read two, six' as 'if x equal to two, then y equal to six.'

Got questions? Get instant answers now!

Practice set a

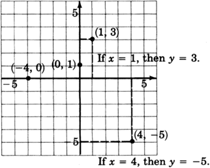
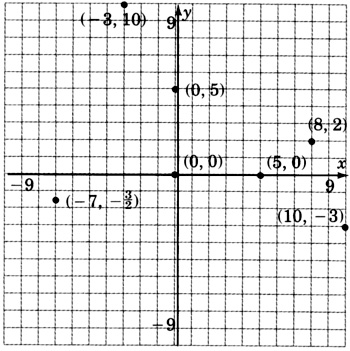
Plot the ordered pairs.

( 1 , 3 ) , ( 4 , 5 ) , ( 0 , 1 ) , ( 4 , 0 ) .

An xy coordinate plane with gridlines, labeled negative five and five with increments of one on both axes.

(Notice that the dotted lines on the graph are only for illustration and should not be included when plotting points.)

An xy coordinate plane with gridlines, labeled negative five and five with increments of one on both axes. The graph contains four plotted coordinate pairs: negative four, zero; one, three; zero, one; and four, negative five.

Got questions? Get instant answers now!

Exercises

Plot the following ordered pairs. (Do not draw the arrows as in Practice Set A.)
( 8 , 2 ) , ( 10 , 3 ) , ( 3 , 10 ) , ( 0 , 5 ) , ( 5 , 0 ) , ( 0 , 0 ) , ( 7 , 3 2 ) .
An xy coordinate plane with gridlines, labeled negative ten and ten with increments of one on both axes.


Total seven points plotted in an xy-coordinate plane. The coordinates of these points are negative three, ten; zero, five; zero, zero; five, zero; eight, two; ten, negative three; and negative seven, negative three over two.

Got questions? Get instant answers now!

As accurately as possible, state the coordinates of the points that have been plotted on the following graph.

An xy coordinate plane with gridlines, labeled negative ten and ten with increments of one on both axes and labels every two units. Points A, B, C, D, E, F, G, H, I, J, K, L, M, N, P are plotted without specifying the coordinates of each point.

Got questions? Get instant answers now!

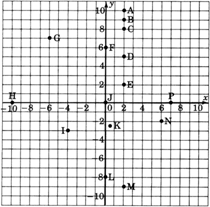
Using ordered pair notation, what are the coordinates of the origin?

Coordinates of the origin are ( 0 , 0 ) .

Got questions? Get instant answers now!

We know that solutions to linear equations in two variables can be expressed as ordered pairs. Hence, the solutions can be represented as points in the plane. Consider the linear equation y = 2 x 1 . Find at least ten solutions to this equation by choosing x -values between 4 and 5 and computing the corresponding y -values . Plot these solutions on the coordinate system below. Fill in the table to help you keep track of the ordered pairs.

x                                                            
y                                                            


An xy coordinate plane with gridlines, from negative ten to ten in increments of one on both axes and labels every two units.

Keeping in mind that there are infinitely many ordered pair solutions to y = 2 x 1 , speculate on the geometric structure of the graph of all the solutions. Complete the following statement:

The name of the type of geometric structure of the graph of all the solutions to the linear equation
y = 2 x 1 seems to be __________ .

Where does this figure cross the y -axis ? Does this number appear in the equation y = 2 x 1 ?

Place your pencil at any point on the figure (you may have to connect the dots to see the figure clearly). Move your pencil exactly one unit to the right (horizontally). To get back onto the figure, you must move your pencil either up or down a particular number of units. How many units must you move vertically to get back onto the figure, and do you see this number in the equation y = 2 x 1 ?

Got questions? Get instant answers now!

Consider the x y -plane .

A rectangular coordinate system with quadrants labeled I, II, III, and IV starting at the quadrant located in the upper right-hand side and going around counterclockwise.

Complete the table by writing the appropriate inequalities.
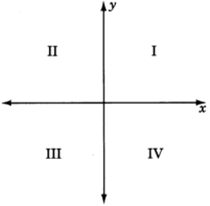
I II III IV
x > 0 x < 0 x x
y > 0 y y y


In the following problems, the graphs of points are called scatter diagrams and are frequently used by statisticians to determine if there is a relationship between the two variables under consideration. The first component of the ordered pair is called the input variable and the second component is called the output variable . Construct the scatter diagrams. Determine if there appears to be a relationship between the two variables under consideration by making the following observations: A relationship may exist if
  1. as one variable increases, the other variable increases
  2. as one variable increases, the other variable decreases

I II III IV
x > 0 x < 0 x < 0 x > 0
y > 0 y > 0 y < 0 y < 0
Got questions? Get instant answers now!

A psychologist, studying the effects of a placebo on assembly line workers at a particular industrial site, noted the time it took to assemble a certain item before the subject was given the placebo, x , and the time it took to assemble a similar item after the subject was given the placebo, y . The psychologist's data are

x y
10 8
12 9
11 9
10 7
14 11
15 12
13 10


An xy coordinate plane with no grid lines. The x-axis goes to fifteen and the y axis goes to twelve. The x-axis is broken to start at ten and then increases at an interval of one unit. The y-axis is broken to start at six and then increases at an interval of twelve.

Got questions? Get instant answers now!

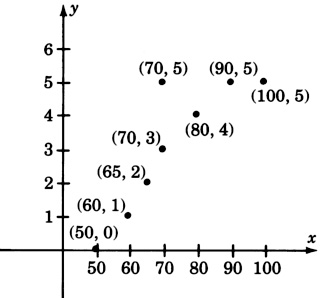
The following data were obtained in an engineer’s study of the relationship between the amount of pressure used to form a piece of machinery, x , and the number of defective pieces of machinery produced, y .

x y
50 0
60 1
65 2
70 3
80 4
70 5
90 5
100 5


An xy coordinate plane with no grid lines. The x-axis goes to one hundred and the y axis goes to six. The x-axis is broken to start at fifty and then increases at an interval of ten units. The y-axis goes to six in increments of one.

Yes, there does appear to be a relation.

Total eight points plotted in an xy coordinate plane with no grid lines. The x-axis goes to one hundred and the y-axis goes to six. The x-axis starts at fifty and then increases at an interval of ten units. The y-axis goes to six in increments of one. The coordinates of points are fifty, zero; sixty, one; sixty-five, two; seventy, three;seventy, five; eighty, four; ninety, five; and one hundred, five.

Got questions? Get instant answers now!

The following data represent the number of work days missed per year, x , by the employees of an insurance company and the number of minutes they arrive late from lunch, y .

x y
1 3
6 4
2 2
2 3
3 1
1 4
4 4
6 3
5 2
6 1


An xy coordinate plane with no grid lines. The x-axis goes to seven in increments of one and the y-axis goes to five in increments of one.

Got questions? Get instant answers now!

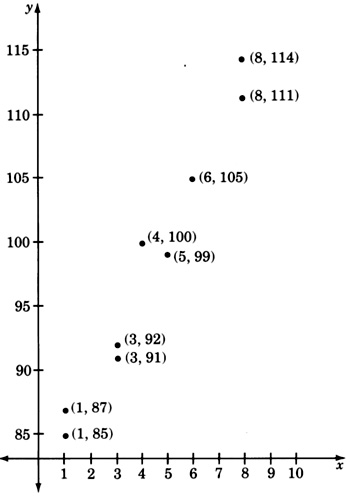
A manufacturer of dental equipment has the following data on the unit cost (in dollars), y , of a particular item and the number of units, x , manufactured for each order.

x y
1 85
3 92
5 99
3 91
4 100
1 87
6 105
8 111
8 114


An xy coordinate plane with no grid lines. The x-axis goes to ten in increments of one. The y axis is broken to start at eighty five and going in increments of fifteen thereafter, with the last label as one hundred and fifteen. The x-axis goes to ten in increments of one.

Yes, there does appear to be a relation.

Total nine points plotted in an xy-coordinate plane with no grid lines. The x-axis goes to ten and the y-axis goes to one hundred fifteen. The y-axis starts at eighty-five and then increases at an interval of five units. The x-axis goes to ten in increments of one. The coordinates of points are one, eighty-five; one, eighty-seven; three, ninety-one; three, ninety-two; four, one hundred; five,ninety-nine; six, one hundred five; eight, one hundred eleven; and eight, one hundred fourteen.

Got questions? Get instant answers now!

Exercises for review

( [link] ) Simplify ( 18 x 5 y 6 9 x 2 y 4 ) 5 .

Got questions? Get instant answers now!

( [link] ) Supply the missing word. An is a statement that two algebraic expressions are equal.

equation

Got questions? Get instant answers now!

( [link] ) Simplify the expression 5 x y ( x y 2 x + 3 y ) 2 x y ( 3 x y 4 x ) 15 x y 2 .

Got questions? Get instant answers now!

( [link] ) Identify the equation x + 2 = x + 1 as an identity, a contradiction, or a conditional equation.

contradiction

Got questions? Get instant answers now!

( [link] ) Supply the missing phrase. A system of axes constructed for graphing an equation is called a .

Got questions? Get instant answers now!

Questions & Answers

it is the relatively stable flow of income
Chidubem Reply
what is circular flow of income
Divine Reply
branches of macroeconomics
SHEDRACK Reply
what is Flexible exchang rate?
poudel Reply
is gdp a reliable measurement of wealth
Atega Reply
introduction to econometrics
Husseini Reply
Hi
mostafa
hi
LEMLEM
hello
Sammol
hi
Mahesh
bi
Ruqayat
hi
Ruqayat
Hi fellas
Nyawa
hey
Sammol
hi
God
hello
Jahara
Good morning
Jorge
hi
abubakar
hi
Nmesoma
hi
Mahesh
Hi
Tom
Why is unemployment rate never zero at full employment?
Priyanka Reply
bcoz of existence of frictional unemployment in our economy.
Umashankar
what is flexible exchang rate?
poudel
due to existence of the pple with disabilities
Abdulraufu
the demand of a good rises, causing the demand for another good to fall
Rushawn Reply
is it possible to leave every good at the same level
Joseph
I don't think so. because check it, if the demand for chicken increases, people will no longer consume fish like they used to causing a fall in the demand for fish
Anuolu
is not really possible to let the value of a goods to be same at the same time.....
Salome
Suppose the inflation rate is 6%, does it mean that all the goods you purchase will cost 6% more than previous year? Provide with reasoning.
Geetha Reply
Not necessarily. To measure the inflation rate economists normally use an averaged price index of a basket of certain goods. So if you purchase goods included in the basket, you will notice that you pay 6% more, otherwise not necessarily.
Waeth
discus major problems of macroeconomics
Alii Reply
what is the problem of macroeconomics
Yoal
Economic growth Stable prices and low unemployment
Ephraim
explain inflationcause and itis degre
Miresa Reply
what is inflation
Getu
increase in general price levels
WEETO
Good day How do I calculate this question: C= 100+5yd G= 2000 T= 2000 I(planned)=200. Suppose the actual output is 3000. What is the level of planned expenditures at this level of output?
Chisomo Reply
how to calculate actual output?
Chisomo
how to calculate the equilibrium income
Beshir
Criteria for determining money supply
Thapase Reply
who we can define macroeconomics in one line
Muhammad
Aggregate demand
Mohammed
C=k100 +9y and i=k50.calculate the equilibrium level of output
Mercy Reply
Hi
Isiaka
Hi
Geli
hy
Man
👋
Bahunda
hy how are you?
Man
ys
Amisha
how are you guys
Sekou
f9 guys
Amisha
how are you guys
Sekou
ys am also fine
Amisha
fine and you guys
Geli
from Nepal
Amisha
nawalparasi district from belatari
Amisha
nd u
Amisha
I am Camara from Guinea west Africa... happy to meet you guys here
Sekou
ma management ho
Amisha
ahile becheclor ho
Amisha
hjr ktm bta ho ani k kaam grnu hunxa tw
Amisha
belatari
Amisha
1st year ho
Amisha
nd u
Amisha
ahh
Amisha
kaha biratnagar
Amisha
ys
Amisha
kina k vo
Amisha
money as unit of account means what?
Kalombe
A unit of account is something that can be used to value goods and services and make calculations
Jim
all of you please speak in English I can't understand you're language
Muhammad
I want to know how can we define macroeconomics in one line
Muhammad
it must be .9 or 0.9 no Mpc is greater than 1 Y=100+.9Y+50 Y-.9Y=150 0.1Y/0.1=150/0.1 Y=1500
Kalombe
Mercy is it clear?😋
Kalombe
hi can someone help me on this question If a negative shocks shifts the IS curve to the left, what type of policy do you suggest so as to stabilize the level of output? discuss your answer using appropriate graph.
Galge Reply
if interest rate is increased this will will reduce the level of income shifting the curve to the left ◀️
Kalombe
Got questions? Join the online conversation and get instant answers!
Jobilize.com Reply

Get Jobilize Job Search Mobile App in your pocket Now!

Get it on Google Play Download on the App Store Now


Source:  OpenStax, Elementary algebra. OpenStax CNX. May 08, 2009 Download for free at http://cnx.org/content/col10614/1.3
Google Play and the Google Play logo are trademarks of Google Inc.

Notification Switch

Would you like to follow the 'Elementary algebra' conversation and receive update notifications?

Ask