<< Chapter < Page Chapter >> Page >

Waves

A wave    is an oscillation or periodic movement that can transport energy from one point in space to another. Common examples of waves are all around us. Shaking the end of a rope transfers energy from your hand to the other end of the rope, dropping a pebble into a pond causes waves to ripple outward along the water's surface, and the expansion of air that accompanies a lightning strike generates sound waves (thunder) that can travel outward for several miles. In each of these cases, kinetic energy is transferred through matter (the rope, water, or air) while the matter remains essentially in place. An insightful example of a wave occurs in sports stadiums when fans in a narrow region of seats rise simultaneously and stand with their arms raised up for a few seconds before sitting down again while the fans in neighboring sections likewise stand up and sit down in sequence. While this wave can quickly encircle a large stadium in a few seconds, none of the fans actually travel with the wave-they all stay in or above their seats.

Waves need not be restricted to travel through matter. As Maxwell showed, electromagnetic waves consist of an electric field oscillating in step with a perpendicular magnetic field, both of which are perpendicular to the direction of travel. These waves can travel through a vacuum at a constant speed of 2.998 × 10 8 m/s, the speed of light (denoted by c ).

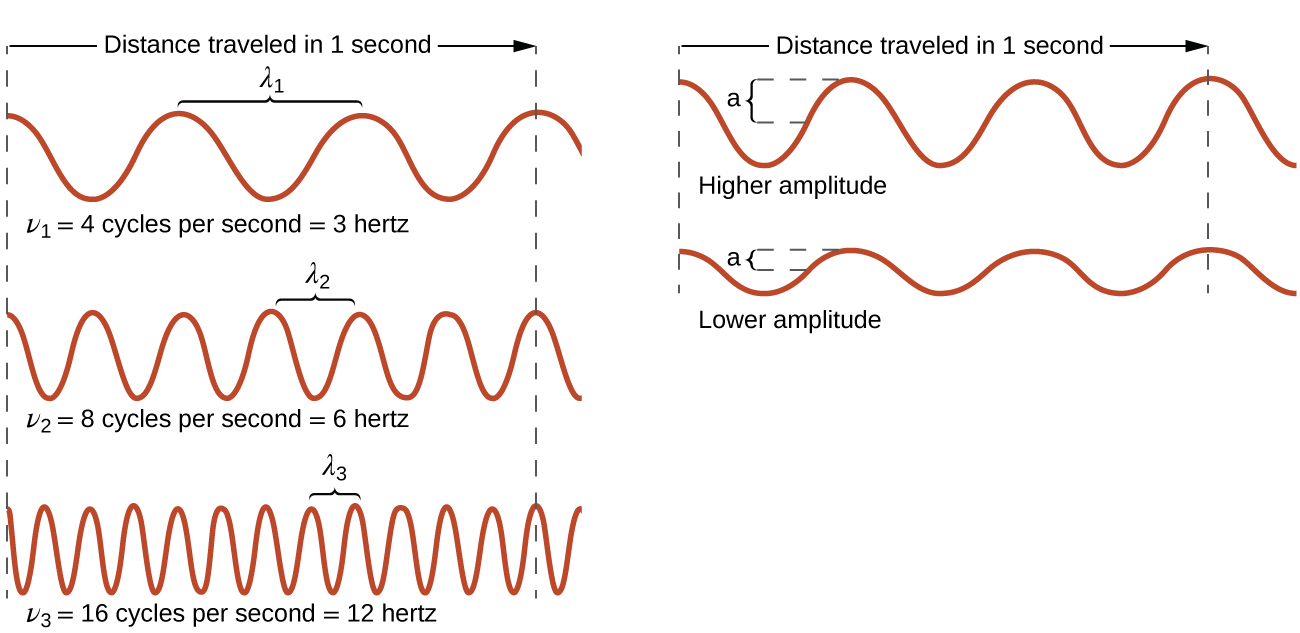
All waves, including forms of electromagnetic radiation, are characterized by, a wavelength (denoted by λ , the lowercase Greek letter lambda), a frequency (denoted by ν , the lowercase Greek letter nu), and an amplitude    . As can be seen in [link] , the wavelength is the distance between two consecutive peaks or troughs in a wave (measured in meters in the SI system). Electromagnetic waves have wavelengths that fall within an enormous range-wavelengths of kilometers (10 3 m) to picometers (10 −12 m) have been observed. The frequency is the number of wave cycles that pass a specified point in space in a specified amount of time (in the SI system, this is measured in seconds). A cycle corresponds to one complete wavelength. The unit for frequency, expressed as cycles per second [s −1 ], is the hertz (Hz)    . Common multiples of this unit are megahertz, (1 MHz = 1 × 10 6 Hz) and gigahertz (1 GHz = 1 × 10 9 Hz). The amplitude corresponds to the magnitude of the wave's displacement and so, in [link] , this corresponds to one-half the height between the peaks and troughs. The amplitude is related to the intensity of the wave, which for light is the brightness, and for sound is the loudness.

This figure includes 5 one-dimensional sinusoidal waves in two columns. The column on the left includes three waves, and the column on the right includes two waves. In each column, dashed vertical line segments extend down the left and right sides of the column. A right pointing arrow extends from the left dashed line to the right dashed line in both columns and is labeled, “Distance traveled in 1 second.” The waves all begin on the left side at a crest. The wave at the upper left shows 3 peaks to the right of the starting point. A bracket labeled, “lambda subscript 1,” extends upward from the second and third peaks. Beneath this wave is the label, “nu subscript 1 equals 4 cycles per second equals 3 hertz.” The wave below has six peaks to the right of the starting point with a bracket similarly connecting the third and fourth peaks which is labeled, “lambda subscript 2.” Beneath this wave is the label, “nu subscript 2 equals 8 cycles per second equals 6 hertz” The third wave in the column has twelve peaks to the right of the starting point with a bracket similarly connecting the seventh and eighth peaks which is labeled, “lambda subscript 3.” Beneath this wave is the label, “nu subscript 3 equals 12 cycles per second equals 12 hertz.” All waves in this column appear to have the same vertical distance from peak to trough. In the second column, the two waves are similarly shown, but lack the lambda labels. The top wave in this column has a greater vertical distance between the peaks and troughs and is labeled, “Higher amplitude.” The wave beneath it has a lesser distance between the peaks and troughs and is labeled, “Lower amplitude.”
One-dimensional sinusoidal waves show the relationship among wavelength, frequency, and speed. The wave with the shortest wavelength has the highest frequency. Amplitude is one-half the height of the wave from peak to trough.

The product of a wave's wavelength ( λ ) and its frequency ( ν ), λν , is the speed of the wave. Thus, for electromagnetic radiation in a vacuum:

c = 2.998 × 10 8 ms −1 = λ ν

Wavelength and frequency are inversely proportional: As the wavelength increases, the frequency decreases. The inverse proportionality is illustrated in [link] . This figure also shows the electromagnetic spectrum    , the range of all types of electromagnetic radiation. Each of the various colors of visible light has specific frequencies and wavelengths associated with them, and you can see that visible light makes up only a small portion of the electromagnetic spectrum. Because the technologies developed to work in various parts of the electromagnetic spectrum are different, for reasons of convenience and historical legacies, different units are typically used for different parts of the spectrum. For example, radio waves are usually specified as frequencies (typically in units of MHz), while the visible region is usually specified in wavelengths (typically in units of nm or angstroms).

Questions & Answers

differentiate between demand and supply giving examples
Lambiv Reply
differentiated between demand and supply using examples
Lambiv
what is labour ?
Lambiv
how will I do?
Venny Reply
how is the graph works?I don't fully understand
Rezat Reply
information
Eliyee
devaluation
Eliyee
t
WARKISA
hi guys good evening to all
Lambiv
multiple choice question
Aster Reply
appreciation
Eliyee
explain perfect market
Lindiwe Reply
In economics, a perfect market refers to a theoretical construct where all participants have perfect information, goods are homogenous, there are no barriers to entry or exit, and prices are determined solely by supply and demand. It's an idealized model used for analysis,
Ezea
What is ceteris paribus?
Shukri Reply
other things being equal
AI-Robot
When MP₁ becomes negative, TP start to decline. Extuples Suppose that the short-run production function of certain cut-flower firm is given by: Q=4KL-0.6K2 - 0.112 • Where is quantity of cut flower produced, I is labour input and K is fixed capital input (K-5). Determine the average product of lab
Kelo
Extuples Suppose that the short-run production function of certain cut-flower firm is given by: Q=4KL-0.6K2 - 0.112 • Where is quantity of cut flower produced, I is labour input and K is fixed capital input (K-5). Determine the average product of labour (APL) and marginal product of labour (MPL)
Kelo
yes,thank you
Shukri
Can I ask you other question?
Shukri
what is monopoly mean?
Habtamu Reply
What is different between quantity demand and demand?
Shukri Reply
Quantity demanded refers to the specific amount of a good or service that consumers are willing and able to purchase at a give price and within a specific time period. Demand, on the other hand, is a broader concept that encompasses the entire relationship between price and quantity demanded
Ezea
ok
Shukri
how do you save a country economic situation when it's falling apart
Lilia Reply
what is the difference between economic growth and development
Fiker Reply
Economic growth as an increase in the production and consumption of goods and services within an economy.but Economic development as a broader concept that encompasses not only economic growth but also social & human well being.
Shukri
production function means
Jabir
What do you think is more important to focus on when considering inequality ?
Abdisa Reply
any question about economics?
Awais Reply
sir...I just want to ask one question... Define the term contract curve? if you are free please help me to find this answer 🙏
Asui
it is a curve that we get after connecting the pareto optimal combinations of two consumers after their mutually beneficial trade offs
Awais
thank you so much 👍 sir
Asui
In economics, the contract curve refers to the set of points in an Edgeworth box diagram where both parties involved in a trade cannot be made better off without making one of them worse off. It represents the Pareto efficient allocations of goods between two individuals or entities, where neither p
Cornelius
In economics, the contract curve refers to the set of points in an Edgeworth box diagram where both parties involved in a trade cannot be made better off without making one of them worse off. It represents the Pareto efficient allocations of goods between two individuals or entities,
Cornelius
Suppose a consumer consuming two commodities X and Y has The following utility function u=X0.4 Y0.6. If the price of the X and Y are 2 and 3 respectively and income Constraint is birr 50. A,Calculate quantities of x and y which maximize utility. B,Calculate value of Lagrange multiplier. C,Calculate quantities of X and Y consumed with a given price. D,alculate optimum level of output .
Feyisa Reply
Answer
Feyisa
c
Jabir
the market for lemon has 10 potential consumers, each having an individual demand curve p=101-10Qi, where p is price in dollar's per cup and Qi is the number of cups demanded per week by the i th consumer.Find the market demand curve using algebra. Draw an individual demand curve and the market dema
Gsbwnw Reply
suppose the production function is given by ( L, K)=L¼K¾.assuming capital is fixed find APL and MPL. consider the following short run production function:Q=6L²-0.4L³ a) find the value of L that maximizes output b)find the value of L that maximizes marginal product
Abdureman
types of unemployment
Yomi Reply
What is the difference between perfect competition and monopolistic competition?
Mohammed
Got questions? Join the online conversation and get instant answers!
Jobilize.com Reply

Get Jobilize Job Search Mobile App in your pocket Now!

Get it on Google Play Download on the App Store Now


Source:  OpenStax, Chemistry. OpenStax CNX. May 20, 2015 Download for free at http://legacy.cnx.org/content/col11760/1.9
Google Play and the Google Play logo are trademarks of Google Inc.

Notification Switch

Would you like to follow the 'Chemistry' conversation and receive update notifications?

Ask