<< Chapter < Page Chapter >> Page >

Volume and pressure: boyle’s law

If we partially fill an airtight syringe with air, the syringe contains a specific amount of air at constant temperature, say 25 °C. If we slowly push in the plunger while keeping temperature constant, the gas in the syringe is compressed into a smaller volume and its pressure increases; if we pull out the plunger, the volume increases and the pressure decreases. This example of the effect of volume on the pressure of a given amount of a confined gas is true in general. Decreasing the volume of a contained gas will increase its pressure, and increasing its volume will decrease its pressure. In fact, if the volume increases by a certain factor, the pressure decreases by the same factor, and vice versa. Volume-pressure data for an air sample at room temperature are graphed in [link] .
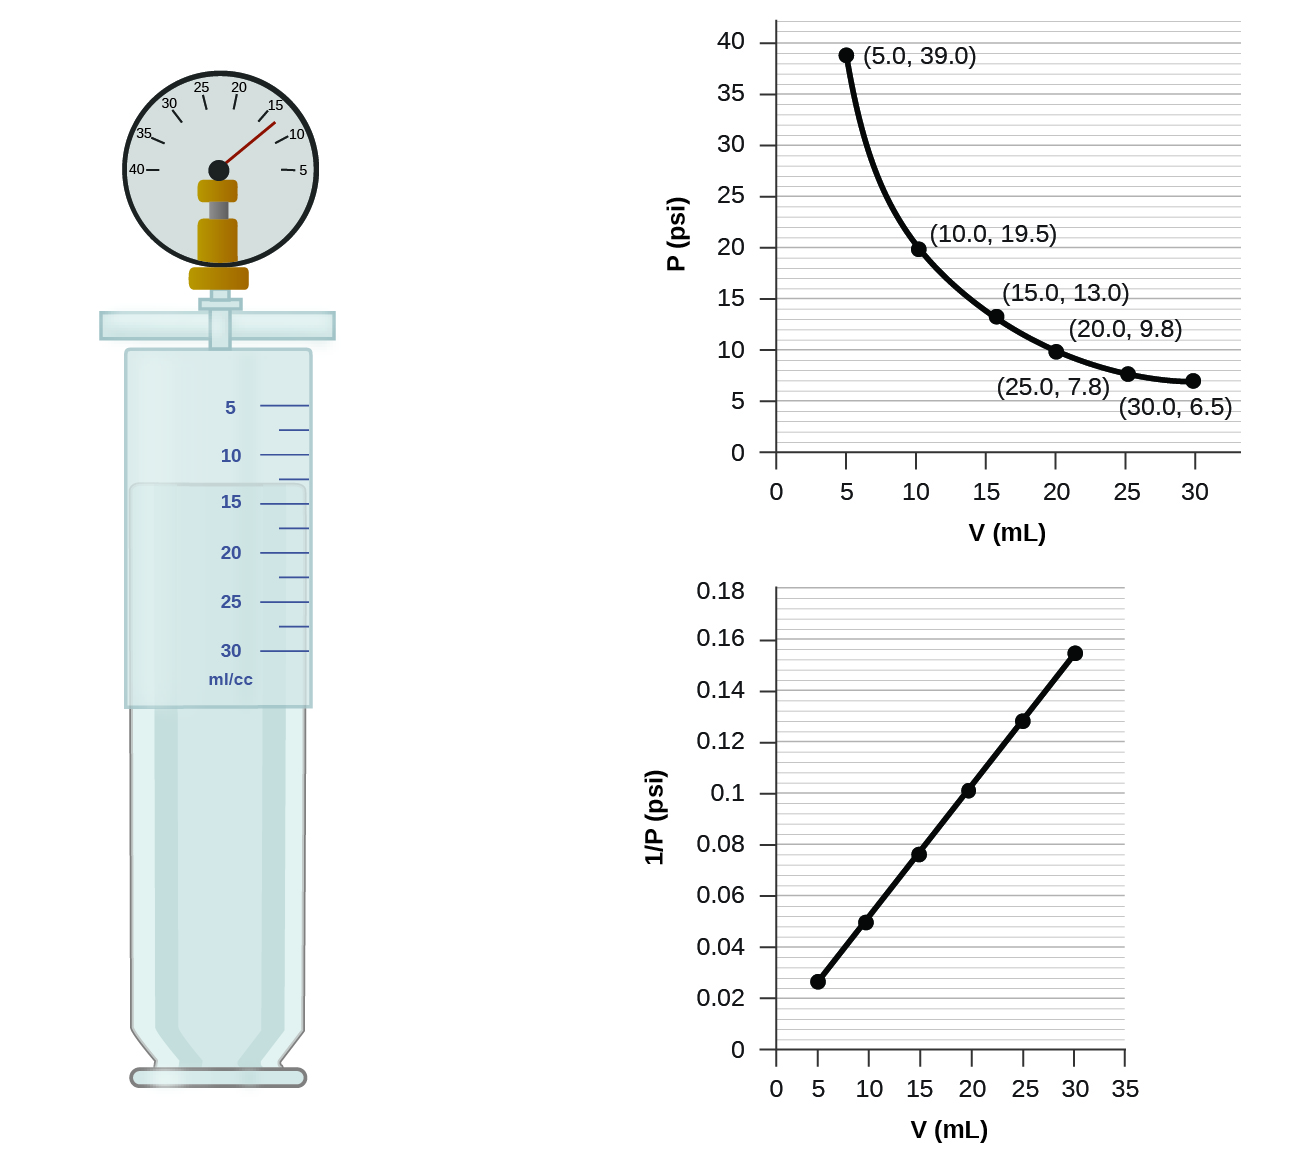
This figure contains a diagram and two graphs. The diagram shows a syringe labeled with a scale in m l or c c with multiples of 5 labeled beginning at 5 and ending at 30. The markings halfway between these measurements are also provided. Attached at the top of the syringe is a pressure gauge with a scale marked by fives from 40 on the left to 5 on the right. The gauge needle rests between 10 and 15, slightly closer to 15. The syringe plunger position indicates a volume measurement about halfway between 10 and 15 m l or c c. The first graph is labeled “V ( m L )” on the horizontal axis and “P ( p s i )” on the vertical axis. Points are labeled at 5, 10, 15, 20, and 25 m L with corresponding values of 39.0, 19.5, 13.0, 9.8, and 6.5 p s i. The points are connected with a smooth curve that is declining at a decreasing rate of change. The second graph is labeled “V ( m L )” on the horizontal axis and “1 divided by P ( p s i )” on the vertical axis. The horizontal axis is labeled at multiples of 5, beginning at zero and extending up to 35 m L. The vertical axis is labeled by multiples of 0.02, beginning at 0 and extending up to 0.18. Six points indicated by black dots on this graph are connected with a black line segment showing a positive linear trend.
When a gas occupies a smaller volume, it exerts a higher pressure; when it occupies a larger volume, it exerts a lower pressure (assuming the amount of gas and the temperature do not change). Since P and V are inversely proportional, a graph of 1 P vs. V is linear.

Unlike the P - T and V - T relationships, pressure and volume are not directly proportional to each other. Instead, P and V exhibit inverse proportionality: Increasing the pressure results in a decrease of the volume of the gas. Mathematically this can be written:

P α 1 / V or P = k · 1 / V or P · V = k or P 1 V 1 = P 2 V 2

with k being a constant. Graphically, this relationship is shown by the straight line that results when plotting the inverse of the pressure ( 1 P ) versus the volume ( V ), or the inverse of volume ( 1 V ) versus the pressure ( P ). Graphs with curved lines are difficult to read accurately at low or high values of the variables, and they are more difficult to use in fitting theoretical equations and parameters to experimental data. For those reasons, scientists often try to find a way to “linearize” their data. If we plot P versus V , we obtain a hyperbola (see [link] ).
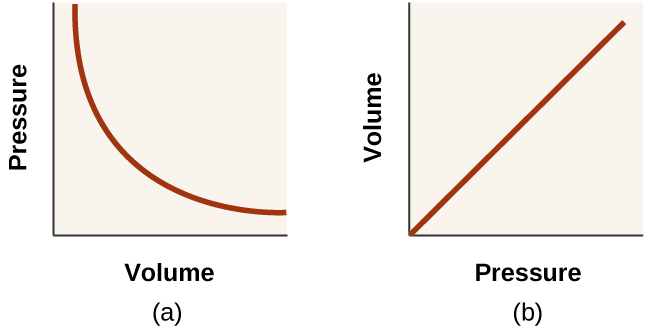
This diagram shows two graphs. In a, a graph is shown with volume on the horizontal axis and pressure on the vertical axis. A curved line is shown on the graph showing a decreasing trend with a decreasing rate of change. In b, a graph is shown with volume on the horizontal axis and one divided by pressure on the vertical axis. A line segment, beginning at the origin of the graph, shows a positive, linear trend.
The relationship between pressure and volume is inversely proportional. (a) The graph of P vs. V is a hyperbola, whereas (b) the graph of ( 1 P ) vs. V is linear.

The relationship between the volume and pressure of a given amount of gas at constant temperature was first published by the English natural philosopher Robert Boyle over 300 years ago. It is summarized in the statement now known as Boyle’s law    : The volume of a given amount of gas held at constant temperature is inversely proportional to the pressure under which it is measured.

Volume of a gas sample

The sample of gas in [link] has a volume of 15.0 mL at a pressure of 13.0 psi. Determine the pressure of the gas at a volume of 7.5 mL, using:

(a) the P - V graph in [link]

(b) the 1 P vs. V graph in [link]

(c) the Boyle’s law equation

Comment on the likely accuracy of each method.

Solution

(a) Estimating from the P - V graph gives a value for P somewhere around 27 psi.

(b) Estimating from the 1 P versus V graph give a value of about 26 psi.

(c) From Boyle’s law, we know that the product of pressure and volume ( PV ) for a given sample of gas at a constant temperature is always equal to the same value. Therefore we have P 1 V 1 = k and P 2 V 2 = k which means that P 1 V 1 = P 2 V 2 .

Using P 1 and V 1 as the known values 13.0 psi and 15.0 mL, P 2 as the pressure at which the volume is unknown, and V 2 as the unknown volume, we have:

P 1 V 1 = P 2 V 2 or 13.0 psi × 15.0 mL = P 2 × 7.5 mL

Solving:

P 2 = 13.0 psi × 15.0 mL 7.5 mL = 26 psi

It was more difficult to estimate well from the P - V graph, so (a) is likely more inaccurate than (b) or (c). The calculation will be as accurate as the equation and measurements allow.

Check your learning

The sample of gas in [link] has a volume of 30.0 mL at a pressure of 6.5 psi. Determine the volume of the gas at a pressure of 11.0 psi, using:

(a) the P - V graph in [link]

(b) the 1 P vs. V graph in [link]

(c) the Boyle’s law equation

Comment on the likely accuracy of each method.

Answer:

(a) about 17–18 mL; (b) ~18 mL; (c) 17.7 mL; it was more difficult to estimate well from the P - V graph, so (a) is likely more inaccurate than (b); the calculation will be as accurate as the equation and measurements allow

Got questions? Get instant answers now!

Questions & Answers

how do you get the 2/50
Abba Reply
number of sport play by 50 student construct discrete data
Aminu Reply
width of the frangebany leaves on how to write a introduction
Theresa Reply
Solve the mean of variance
Veronica Reply
Step 1: Find the mean. To find the mean, add up all the scores, then divide them by the number of scores. ... Step 2: Find each score's deviation from the mean. ... Step 3: Square each deviation from the mean. ... Step 4: Find the sum of squares. ... Step 5: Divide the sum of squares by n – 1 or N.
kenneth
what is error
Yakuba Reply
Is mistake done to something
Vutshila
Hy
anas
hy
What is the life teble
anas
hy
Jibrin
statistics is the analyzing of data
Tajudeen Reply
what is statics?
Zelalem Reply
how do you calculate mean
Gloria Reply
diveving the sum if all values
Shaynaynay
let A1,A2 and A3 events be independent,show that (A1)^c, (A2)^c and (A3)^c are independent?
Fisaye Reply
what is statistics
Akhisani Reply
data collected all over the world
Shaynaynay
construct a less than and more than table
Imad Reply
The sample of 16 students is taken. The average age in the sample was 22 years with astandard deviation of 6 years. Construct a 95% confidence interval for the age of the population.
Aschalew Reply
Bhartdarshan' is an internet-based travel agency wherein customer can see videos of the cities they plant to visit. The number of hits daily is a normally distributed random variable with a mean of 10,000 and a standard deviation of 2,400 a. what is the probability of getting more than 12,000 hits? b. what is the probability of getting fewer than 9,000 hits?
Akshay Reply
Bhartdarshan'is an internet-based travel agency wherein customer can see videos of the cities they plan to visit. The number of hits daily is a normally distributed random variable with a mean of 10,000 and a standard deviation of 2,400. a. What is the probability of getting more than 12,000 hits
Akshay
1
Bright
Sorry i want to learn more about this question
Bright
Someone help
Bright
a= 0.20233 b=0.3384
Sufiyan
a
Shaynaynay
How do I interpret level of significance?
Mohd Reply
It depends on your business problem or in Machine Learning you could use ROC- AUC cruve to decide the threshold value
Shivam
how skewness and kurtosis are used in statistics
Owen Reply
yes what is it
Taneeya
Got questions? Join the online conversation and get instant answers!
Jobilize.com Reply

Get Jobilize Job Search Mobile App in your pocket Now!

Get it on Google Play Download on the App Store Now


Source:  OpenStax, Chemistry. OpenStax CNX. May 20, 2015 Download for free at http://legacy.cnx.org/content/col11760/1.9
Google Play and the Google Play logo are trademarks of Google Inc.

Notification Switch

Would you like to follow the 'Chemistry' conversation and receive update notifications?

Ask