<< Chapter < Page Chapter >> Page >

Volume and pressure: boyle’s law

If we partially fill an airtight syringe with air, the syringe contains a specific amount of air at constant temperature, say 25 °C. If we slowly push in the plunger while keeping temperature constant, the gas in the syringe is compressed into a smaller volume and its pressure increases; if we pull out the plunger, the volume increases and the pressure decreases. This example of the effect of volume on the pressure of a given amount of a confined gas is true in general. Decreasing the volume of a contained gas will increase its pressure, and increasing its volume will decrease its pressure. In fact, if the volume increases by a certain factor, the pressure decreases by the same factor, and vice versa. Volume-pressure data for an air sample at room temperature are graphed in [link] .
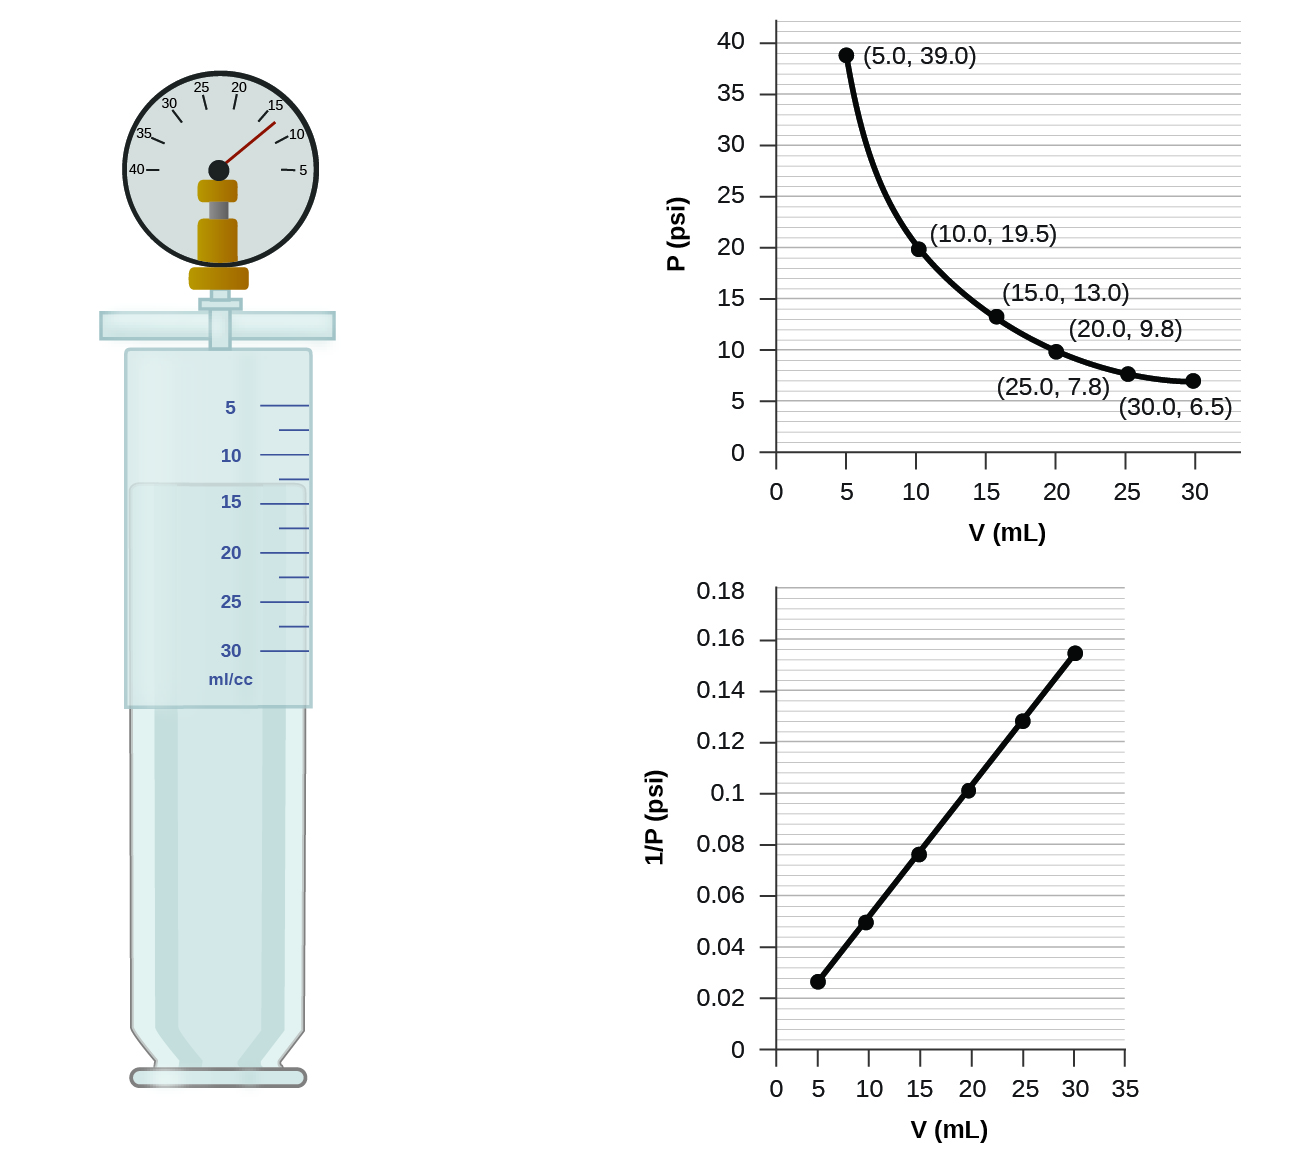
This figure contains a diagram and two graphs. The diagram shows a syringe labeled with a scale in m l or c c with multiples of 5 labeled beginning at 5 and ending at 30. The markings halfway between these measurements are also provided. Attached at the top of the syringe is a pressure gauge with a scale marked by fives from 40 on the left to 5 on the right. The gauge needle rests between 10 and 15, slightly closer to 15. The syringe plunger position indicates a volume measurement about halfway between 10 and 15 m l or c c. The first graph is labeled “V ( m L )” on the horizontal axis and “P ( p s i )” on the vertical axis. Points are labeled at 5, 10, 15, 20, and 25 m L with corresponding values of 39.0, 19.5, 13.0, 9.8, and 6.5 p s i. The points are connected with a smooth curve that is declining at a decreasing rate of change. The second graph is labeled “V ( m L )” on the horizontal axis and “1 divided by P ( p s i )” on the vertical axis. The horizontal axis is labeled at multiples of 5, beginning at zero and extending up to 35 m L. The vertical axis is labeled by multiples of 0.02, beginning at 0 and extending up to 0.18. Six points indicated by black dots on this graph are connected with a black line segment showing a positive linear trend.
When a gas occupies a smaller volume, it exerts a higher pressure; when it occupies a larger volume, it exerts a lower pressure (assuming the amount of gas and the temperature do not change). Since P and V are inversely proportional, a graph of 1 P vs. V is linear.

Unlike the P - T and V - T relationships, pressure and volume are not directly proportional to each other. Instead, P and V exhibit inverse proportionality: Increasing the pressure results in a decrease of the volume of the gas. Mathematically this can be written:

P α 1 / V or P = k · 1 / V or P · V = k or P 1 V 1 = P 2 V 2

with k being a constant. Graphically, this relationship is shown by the straight line that results when plotting the inverse of the pressure ( 1 P ) versus the volume ( V ), or the inverse of volume ( 1 V ) versus the pressure ( P ). Graphs with curved lines are difficult to read accurately at low or high values of the variables, and they are more difficult to use in fitting theoretical equations and parameters to experimental data. For those reasons, scientists often try to find a way to “linearize” their data. If we plot P versus V , we obtain a hyperbola (see [link] ).
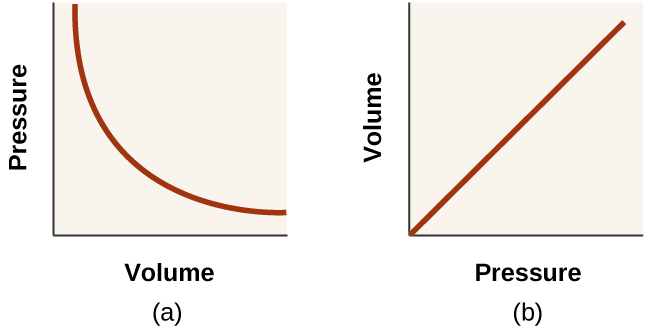
This diagram shows two graphs. In a, a graph is shown with volume on the horizontal axis and pressure on the vertical axis. A curved line is shown on the graph showing a decreasing trend with a decreasing rate of change. In b, a graph is shown with volume on the horizontal axis and one divided by pressure on the vertical axis. A line segment, beginning at the origin of the graph, shows a positive, linear trend.
The relationship between pressure and volume is inversely proportional. (a) The graph of P vs. V is a hyperbola, whereas (b) the graph of ( 1 P ) vs. V is linear.

The relationship between the volume and pressure of a given amount of gas at constant temperature was first published by the English natural philosopher Robert Boyle over 300 years ago. It is summarized in the statement now known as Boyle’s law    : The volume of a given amount of gas held at constant temperature is inversely proportional to the pressure under which it is measured.

Volume of a gas sample

The sample of gas in [link] has a volume of 15.0 mL at a pressure of 13.0 psi. Determine the pressure of the gas at a volume of 7.5 mL, using:

(a) the P - V graph in [link]

(b) the 1 P vs. V graph in [link]

(c) the Boyle’s law equation

Comment on the likely accuracy of each method.

Solution

(a) Estimating from the P - V graph gives a value for P somewhere around 27 psi.

(b) Estimating from the 1 P versus V graph give a value of about 26 psi.

(c) From Boyle’s law, we know that the product of pressure and volume ( PV ) for a given sample of gas at a constant temperature is always equal to the same value. Therefore we have P 1 V 1 = k and P 2 V 2 = k which means that P 1 V 1 = P 2 V 2 .

Using P 1 and V 1 as the known values 13.0 psi and 15.0 mL, P 2 as the pressure at which the volume is unknown, and V 2 as the unknown volume, we have:

P 1 V 1 = P 2 V 2 or 13.0 psi × 15.0 mL = P 2 × 7.5 mL

Solving:

P 2 = 13.0 psi × 15.0 mL 7.5 mL = 26 psi

It was more difficult to estimate well from the P - V graph, so (a) is likely more inaccurate than (b) or (c). The calculation will be as accurate as the equation and measurements allow.

Check your learning

The sample of gas in [link] has a volume of 30.0 mL at a pressure of 6.5 psi. Determine the volume of the gas at a pressure of 11.0 psi, using:

(a) the P - V graph in [link]

(b) the 1 P vs. V graph in [link]

(c) the Boyle’s law equation

Comment on the likely accuracy of each method.

Answer:

(a) about 17–18 mL; (b) ~18 mL; (c) 17.7 mL; it was more difficult to estimate well from the P - V graph, so (a) is likely more inaccurate than (b); the calculation will be as accurate as the equation and measurements allow

Got questions? Get instant answers now!

Questions & Answers

Discuss the differences between taste and flavor, including how other sensory inputs contribute to our  perception of flavor.
John Reply
taste refers to your understanding of the flavor . while flavor one The other hand is refers to sort of just a blend things.
Faith
While taste primarily relies on our taste buds, flavor involves a complex interplay between taste and aroma
Kamara
which drugs can we use for ulcers
Ummi Reply
omeprazole
Kamara
what
Renee
what is this
Renee
is a drug
Kamara
of anti-ulcer
Kamara
Omeprazole Cimetidine / Tagament For the complicated once ulcer - kit
Patrick
what is the function of lymphatic system
Nency Reply
Not really sure
Eli
to drain extracellular fluid all over the body.
asegid
The lymphatic system plays several crucial roles in the human body, functioning as a key component of the immune system and contributing to the maintenance of fluid balance. Its main functions include: 1. Immune Response: The lymphatic system produces and transports lymphocytes, which are a type of
asegid
to transport fluids fats proteins and lymphocytes to the blood stream as lymph
Adama
what is anatomy
Oyindarmola Reply
Anatomy is the identification and description of the structures of living things
Kamara
what's the difference between anatomy and physiology
Oyerinde Reply
Anatomy is the study of the structure of the body, while physiology is the study of the function of the body. Anatomy looks at the body's organs and systems, while physiology looks at how those organs and systems work together to keep the body functioning.
AI-Robot
what is enzymes all about?
Mohammed Reply
Enzymes are proteins that help speed up chemical reactions in our bodies. Enzymes are essential for digestion, liver function and much more. Too much or too little of a certain enzyme can cause health problems
Kamara
yes
Prince
how does the stomach protect itself from the damaging effects of HCl
Wulku Reply
little girl okay how does the stomach protect itself from the damaging effect of HCL
Wulku
it is because of the enzyme that the stomach produce that help the stomach from the damaging effect of HCL
Kamara
function of digestive system
Ali Reply
function of digestive
Ali
the diagram of the lungs
Adaeze Reply
what is the normal body temperature
Diya Reply
37 degrees selcius
Xolo
37°c
Stephanie
please why 37 degree selcius normal temperature
Mark
36.5
Simon
37°c
Iyogho
the normal temperature is 37°c or 98.6 °Fahrenheit is important for maintaining the homeostasis in the body the body regular this temperature through the process called thermoregulation which involves brain skin muscle and other organ working together to maintain stable internal temperature
Stephanie
37A c
Wulku
what is anaemia
Diya Reply
anaemia is the decrease in RBC count hemoglobin count and PVC count
Eniola
what is the pH of the vagina
Diya Reply
how does Lysin attack pathogens
Diya
acid
Mary
I information on anatomy position and digestive system and there enzyme
Elisha Reply
anatomy of the female external genitalia
Muhammad Reply
Organ Systems Of The Human Body (Continued) Organ Systems Of The Human Body (Continued)
Theophilus Reply
what's lochia albra
Kizito
Got questions? Join the online conversation and get instant answers!
Jobilize.com Reply

Get Jobilize Job Search Mobile App in your pocket Now!

Get it on Google Play Download on the App Store Now


Source:  OpenStax, Chemistry. OpenStax CNX. May 20, 2015 Download for free at http://legacy.cnx.org/content/col11760/1.9
Google Play and the Google Play logo are trademarks of Google Inc.

Notification Switch

Would you like to follow the 'Chemistry' conversation and receive update notifications?

Ask