<< Chapter < Page Chapter >> Page >
This graph entitled, “Atomic Radii,” is labeled, “Atomic Number,” on the horizontal axis and, “Radius (p m),” on the vertical axis. Markings are provided every 10 units up to 60 on the horizontal axis beginning at zero. Vertical lines extend from the horizontal axis upward at each of these markings. The vertical axis begins at 0 and increases by 50’s up to 300. Horizontal lines are drawn across the graph at multiples of 50. A black jagged line connects the radii values for elements with atomic numbers 1 through 60 on the graph. Peaks are evident at the locations of the alkali metals: L i, N a, K, R b, and C s, at which points on the graph purple dots are placed and elements are labeled in purple. Similarly, minima exist at the locations of noble or inert gases: H e, N e, A r, K r, X e, and R n, at which points blue dots are placed and element symbols are provided in blue. The locations of period 4 and period 5 transition elements are provided with green dots. These points are clustered together in two locations on the graph which are circled in red and labeled accordingly. The green dots for the transition elements along with the line that connects them form a U shape on the graph within each of the red circles drawn. The atomic radii for the alkali metals in picometers are: L i 167, N a 190, K 243, R b 265, and C s 298. The atomic radii of the noble or inert gases included in the graph in picometers are: H e 31, N e 38, A r 71, K r 88, and X e 108.
Within each period, the trend in atomic radius decreases as Z increases; for example, from K to Kr. Within each group (e.g., the alkali metals shown in purple), the trend is that atomic radius increases as Z increases.

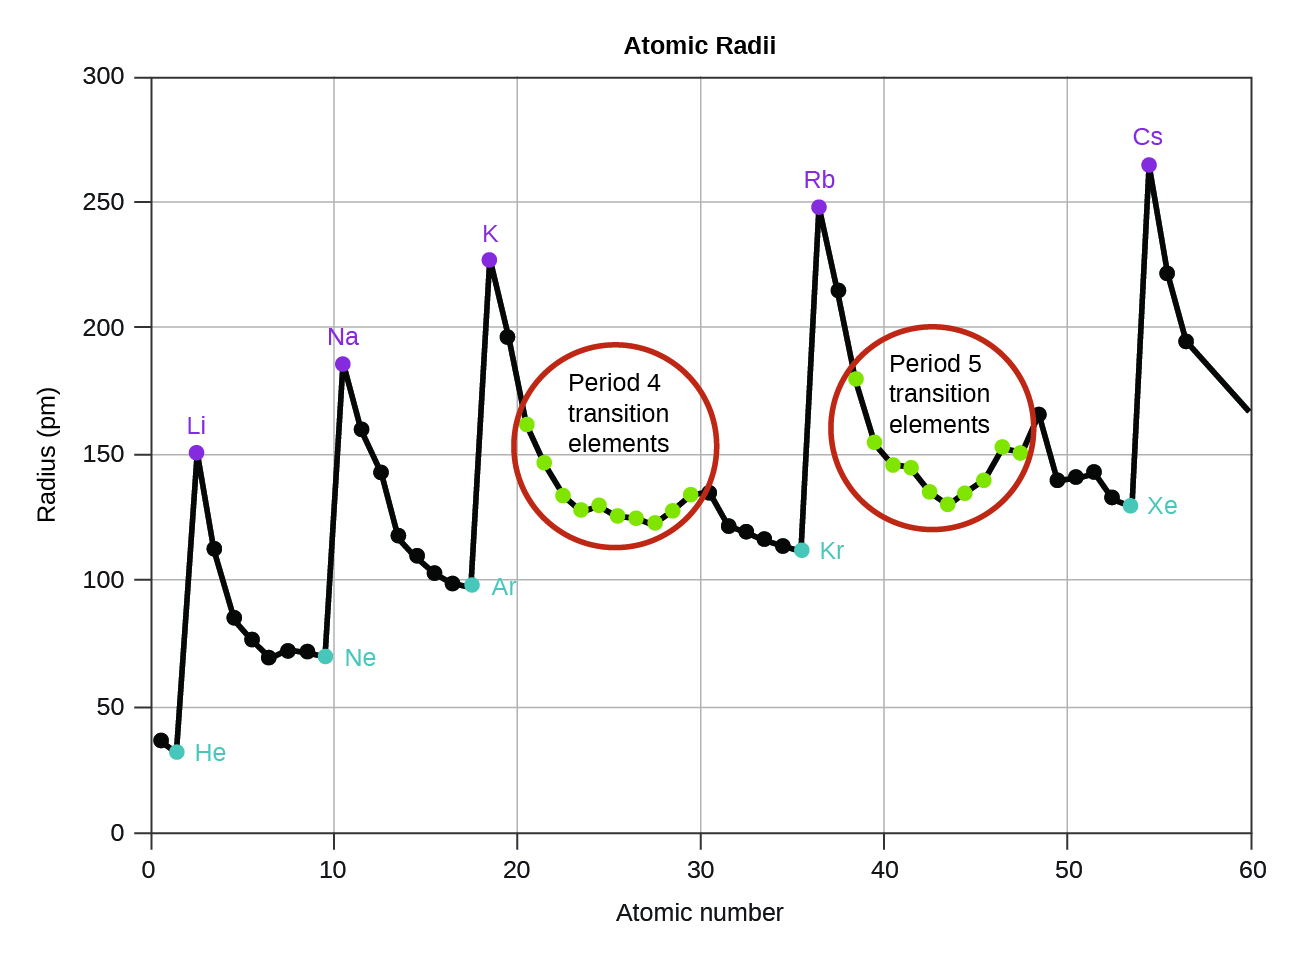
As shown in [link] , as we move across a period from left to right, we generally find that each element has a smaller covalent radius than the element preceding it. This might seem counterintuitive because it implies that atoms with more electrons have a smaller atomic radius. This can be explained with the concept of effective nuclear charge, Z eff . This is the pull exerted on a specific electron by the nucleus, taking into account any electron–electron repulsions. For hydrogen, there is only one electron and so the nuclear charge ( Z ) and the effective nuclear charge ( Z eff ) are equal. For all other atoms, the inner electrons partially shield the outer electrons from the pull of the nucleus, and thus:

Z eff = Z s h i e l d i n g

Shielding is determined by the probability of another electron being between the electron of interest and the nucleus, as well as by the electron–electron repulsions the electron of interest encounters. Core electrons are adept at shielding, while electrons in the same valence shell do not block the nuclear attraction experienced by each other as efficiently. Thus, each time we move from one element to the next across a period, Z increases by one, but the shielding increases only slightly. Thus, Z eff increases as we move from left to right across a period. The stronger pull (higher effective nuclear charge) experienced by electrons on the right side of the periodic table draws them closer to the nucleus, making the covalent radii smaller.

Thus, as we would expect, the outermost or valence electrons are easiest to remove because they have the highest energies, are shielded more, and are farthest from the nucleus. As a general rule, when the representative elements form cations, they do so by the loss of the ns or np electrons that were added last in the Aufbau process. The transition elements, on the other hand, lose the ns electrons before they begin to lose the ( n – 1) d electrons, even though the ns electrons are added first, according to the Aufbau principle.

Sorting atomic radii

Predict the order of increasing covalent radius for Ge, Fl, Br, Kr.

Solution

Radius increases as we move down a group, so Ge<Fl (Note: Fl is the symbol for flerovium, element 114, NOT fluorine). Radius decreases as we move across a period, so Kr<Br<Ge. Putting the trends together, we obtain Kr<Br<Ge<Fl.

Check your learning

Give an example of an atom whose size is smaller than fluorine.

Answer:

Ne or He

Got questions? Get instant answers now!

Variation in ionic radii

Ionic radius is the measure used to describe the size of an ion. A cation always has fewer electrons and the same number of protons as the parent atom; it is smaller than the atom from which it is derived ( [link] ). For example, the covalent radius of an aluminum atom (1 s 2 2 s 2 2 p 6 3 s 2 3 p 1 ) is 118 pm, whereas the ionic radius of an Al 3+ (1 s 2 2 s 2 2 p 6 ) is 68 pm. As electrons are removed from the outer valence shell, the remaining core electrons occupying smaller shells experience a greater effective nuclear charge Z eff (as discussed) and are drawn even closer to the nucleus.

Questions & Answers

how do you get the 2/50
Abba Reply
number of sport play by 50 student construct discrete data
Aminu Reply
width of the frangebany leaves on how to write a introduction
Theresa Reply
Solve the mean of variance
Veronica Reply
Step 1: Find the mean. To find the mean, add up all the scores, then divide them by the number of scores. ... Step 2: Find each score's deviation from the mean. ... Step 3: Square each deviation from the mean. ... Step 4: Find the sum of squares. ... Step 5: Divide the sum of squares by n – 1 or N.
kenneth
what is error
Yakuba Reply
Is mistake done to something
Vutshila
Hy
anas
hy
What is the life teble
anas
hy
Jibrin
statistics is the analyzing of data
Tajudeen Reply
what is statics?
Zelalem Reply
how do you calculate mean
Gloria Reply
diveving the sum if all values
Shaynaynay
let A1,A2 and A3 events be independent,show that (A1)^c, (A2)^c and (A3)^c are independent?
Fisaye Reply
what is statistics
Akhisani Reply
data collected all over the world
Shaynaynay
construct a less than and more than table
Imad Reply
The sample of 16 students is taken. The average age in the sample was 22 years with astandard deviation of 6 years. Construct a 95% confidence interval for the age of the population.
Aschalew Reply
Bhartdarshan' is an internet-based travel agency wherein customer can see videos of the cities they plant to visit. The number of hits daily is a normally distributed random variable with a mean of 10,000 and a standard deviation of 2,400 a. what is the probability of getting more than 12,000 hits? b. what is the probability of getting fewer than 9,000 hits?
Akshay Reply
Bhartdarshan'is an internet-based travel agency wherein customer can see videos of the cities they plan to visit. The number of hits daily is a normally distributed random variable with a mean of 10,000 and a standard deviation of 2,400. a. What is the probability of getting more than 12,000 hits
Akshay
1
Bright
Sorry i want to learn more about this question
Bright
Someone help
Bright
a= 0.20233 b=0.3384
Sufiyan
a
Shaynaynay
How do I interpret level of significance?
Mohd Reply
It depends on your business problem or in Machine Learning you could use ROC- AUC cruve to decide the threshold value
Shivam
how skewness and kurtosis are used in statistics
Owen Reply
yes what is it
Taneeya
Got questions? Join the online conversation and get instant answers!
Jobilize.com Reply
Practice Key Terms 5

Get Jobilize Job Search Mobile App in your pocket Now!

Get it on Google Play Download on the App Store Now


Source:  OpenStax, Chemistry. OpenStax CNX. May 20, 2015 Download for free at http://legacy.cnx.org/content/col11760/1.9
Google Play and the Google Play logo are trademarks of Google Inc.

Notification Switch

Would you like to follow the 'Chemistry' conversation and receive update notifications?

Ask