<< Chapter < Page Chapter >> Page >
E = n h ν , n = 1 , 2 , 3 , . . .

The quantity h is a constant now known as Planck's constant, in his honor. Although Planck was pleased he had resolved the blackbody radiation paradox, he was disturbed that to do so, he needed to assume the vibrating atoms required quantized energies, which he was unable to explain. The value of Planck's constant is very small, 6.626 × 10 −34 joule seconds (J s), which helps explain why energy quantization had not been observed previously in macroscopic phenomena.
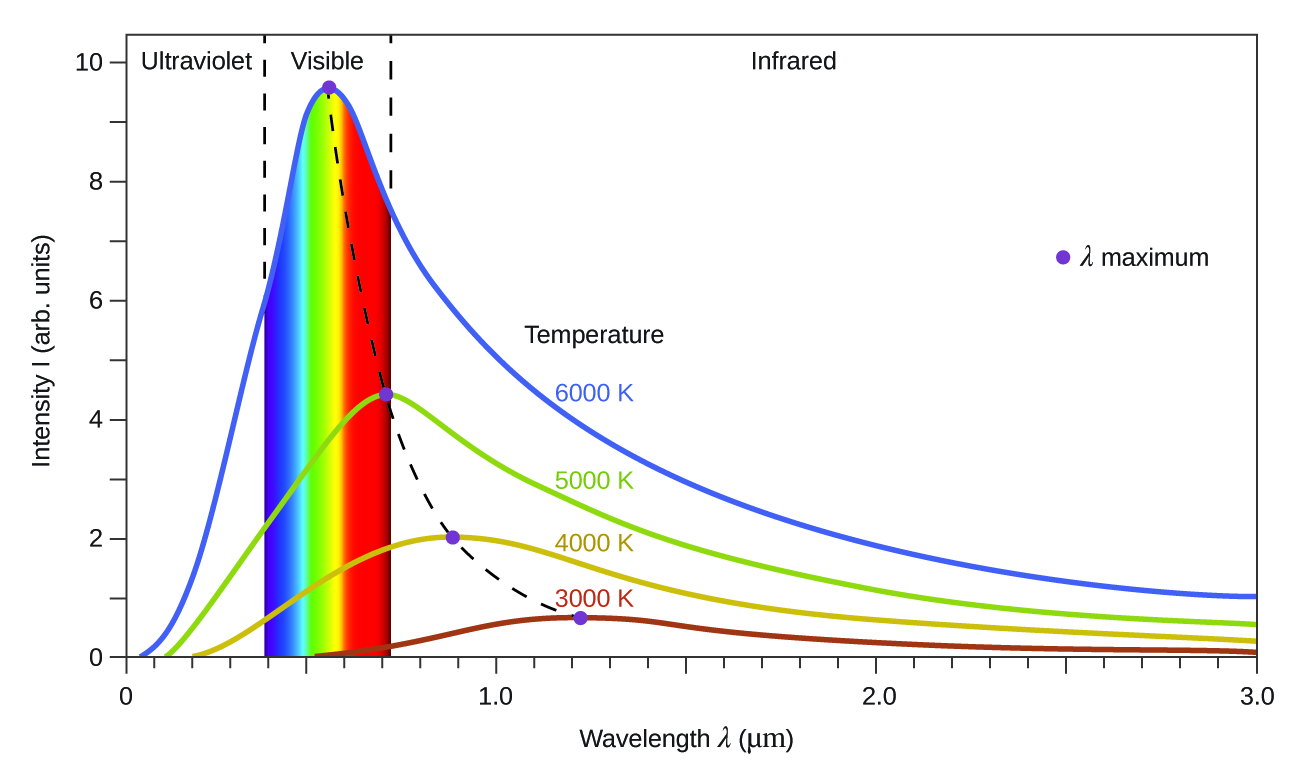
A graph is shown with a horizontal axis labeled, “Wavelength lambda (micrometers)” and a vertical axis labeled, “Intensity I (a r b. units).” The horizontal axis begins at 0 and extends to 3.0 with markings provided every 0.1 micrometer. Similarly, the vertical axis begins at 0 and extends to 10 with markings every 1 unit. Two vertical dashed lines are drawn. The first appears at about 0.39 micrometers and the second at about 0.72 micrometers. To the left of the first of these lines, the label, “Ultraviolet,” appears at the top of the graph. Between these lines, the label, “Visible,” appears at the top of the graph. To the right of the second of these lines, the label, “Infrared,” appears at the top of the graph. To the far right of the graph in open space a purple dot is placed which is labeled, “lambda maximum.” A “Temperature” label is located in a central region of the graph. A blue curve begins on the horizontal axis at about 0.05 micrometers. This curve increases steeply to a maximum value between the two vertical line segments of approximately 9.5 at about 0.55 micrometers. This curve decreases rapidly at first, then tapers off to reach a value of about 1.5 at the far right end of the graph. This blue curve is labeled 6000 K beneath the “Temperature” label. Curves are similarly drawn in green for 5000 K, orange for 4000 K, and red for 3000 K. As the temperature decreases, the height of the peak is lower and shifted right on the graph. The maximum value for the green curve is around 4.5 at 7.2 micrometers. This curve tapers at the right end of the graph to a value around 0.6. The maximum for the orange curve is around 2 at about 0.9 micrometers. This curve tapers at the right end of the graph to a value around 0.2. The maximum for the red curve is around 0.7 at about 1.2 micrometers. This curve tapers at the right end of the graph to a value around 0.1. The entire region under the blue curve that is between the two dashed lines, indicating the visible region, is shaded with vertical bands of color. The colors extending left to right across this region are violet, indigo, blue, green, yellow, orange, and red. A purple dot is placed at the peak of each of the four colored curves. These peaks are connected with a dashed curve.
Blackbody spectral distribution curves are shown for some representative temperatures.

The photoelectric effect

The next paradox in the classical theory to be resolved concerned the photoelectric effect ( [link] ). It had been observed that electrons could be ejected from the clean surface of a metal when light having a frequency greater than some threshold frequency was shone on it. Surprisingly, the kinetic energy of the ejected electrons did not depend on the brightness of the light, but increased with increasing frequency of the light. Since the electrons in the metal had a certain amount of binding energy keeping them there, the incident light needed to have more energy to free the electrons. According to classical wave theory, a wave's energy depends on its intensity (which depends on its amplitude), not its frequency. One part of these observations was that the number of electrons ejected within in a given time period was seen to increase as the brightness increased. In 1905, Albert Einstein was able to resolve the paradox by incorporating Planck's quantization findings into the discredited particle view of light (Einstein actually won his Nobel prize for this work, and not for his theories of relativity for which he is most famous).

Einstein argued that the quantized energies that Planck had postulated in his treatment of blackbody radiation could be applied to the light in the photoelectric effect so that the light striking the metal surface should not be viewed as a wave, but instead as a stream of particles (later called photons ) whose energy depended on their frequency, according to Planck's formula, E = (or, in terms of wavelength using c = νλ , E = h c λ ). Electrons were ejected when hit by photons having sufficient energy (a frequency greater than the threshold). The greater the frequency, the greater the kinetic energy imparted to the escaping electrons by the collisions. Einstein also argued that the light intensity did not depend on the amplitude of the incoming wave, but instead corresponded to the number of photons striking the surface within a given time period. This explains why the number of ejected electrons increased with increasing brightness, since the greater the number of incoming photons, the greater the likelihood that they would collide with some of the electrons.

With Einstein's findings, the nature of light took on a new air of mystery. Although many light phenomena could be explained either in terms of waves or particles, certain phenomena, such as the interference patterns obtained when light passed through a double slit, were completely contrary to a particle view of light, while other phenomena, such as the photoelectric effect, were completely contrary to a wave view of light. Somehow, at a deep fundamental level still not fully understood, light is both wavelike and particle-like. This is known as wave-particle duality    .

Questions & Answers

what is phylogeny
Odigie Reply
evolutionary history and relationship of an organism or group of organisms
AI-Robot
ok
Deng
what is biology
Hajah Reply
the study of living organisms and their interactions with one another and their environments
AI-Robot
what is biology
Victoria Reply
HOW CAN MAN ORGAN FUNCTION
Alfred Reply
the diagram of the digestive system
Assiatu Reply
allimentary cannel
Ogenrwot
How does twins formed
William Reply
They formed in two ways first when one sperm and one egg are splited by mitosis or two sperm and two eggs join together
Oluwatobi
what is genetics
Josephine Reply
Genetics is the study of heredity
Misack
how does twins formed?
Misack
What is manual
Hassan Reply
discuss biological phenomenon and provide pieces of evidence to show that it was responsible for the formation of eukaryotic organelles
Joseph Reply
what is biology
Yousuf Reply
the study of living organisms and their interactions with one another and their environment.
Wine
discuss the biological phenomenon and provide pieces of evidence to show that it was responsible for the formation of eukaryotic organelles in an essay form
Joseph Reply
what is the blood cells
Shaker Reply
list any five characteristics of the blood cells
Shaker
lack electricity and its more savely than electronic microscope because its naturally by using of light
Abdullahi Reply
advantage of electronic microscope is easily and clearly while disadvantage is dangerous because its electronic. advantage of light microscope is savely and naturally by sun while disadvantage is not easily,means its not sharp and not clear
Abdullahi
cell theory state that every organisms composed of one or more cell,cell is the basic unit of life
Abdullahi
is like gone fail us
DENG
cells is the basic structure and functions of all living things
Ramadan
What is classification
ISCONT Reply
is organisms that are similar into groups called tara
Yamosa
in what situation (s) would be the use of a scanning electron microscope be ideal and why?
Kenna Reply
A scanning electron microscope (SEM) is ideal for situations requiring high-resolution imaging of surfaces. It is commonly used in materials science, biology, and geology to examine the topography and composition of samples at a nanoscale level. SEM is particularly useful for studying fine details,
Hilary
Got questions? Join the online conversation and get instant answers!
Jobilize.com Reply

Get Jobilize Job Search Mobile App in your pocket Now!

Get it on Google Play Download on the App Store Now


Source:  OpenStax, Chemistry. OpenStax CNX. May 20, 2015 Download for free at http://legacy.cnx.org/content/col11760/1.9
Google Play and the Google Play logo are trademarks of Google Inc.

Notification Switch

Would you like to follow the 'Chemistry' conversation and receive update notifications?

Ask