<< Chapter < Page Chapter >> Page >

When atomic orbitals hybridize, the valence electrons occupy the newly created orbitals. The Be atom had two valence electrons, so each of the sp orbitals gets one of these electrons. Each of these electrons pairs up with the unpaired electron on a chlorine atom when a hybrid orbital and a chlorine orbital overlap during the formation of the Be–Cl bonds.

Any central atom surrounded by just two regions of valence electron density in a molecule will exhibit sp hybridization. Other examples include the mercury atom in the linear HgCl 2 molecule, the zinc atom in Zn(CH 3 ) 2 , which contains a linear C–Zn–C arrangement, and the carbon atoms in HCCH and CO 2 .

sp 2 Hybridization

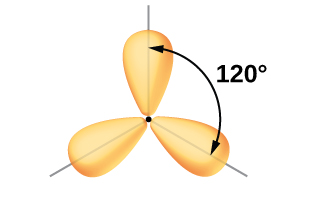
The valence orbitals of a central atom surrounded by three regions of electron density consist of a set of three sp 2 hybrid orbitals and one unhybridized p orbital. This arrangement results from sp 2 hybridization, the mixing of one s orbital and two p orbitals to produce three identical hybrid orbitals oriented in a trigonal planar geometry ( [link] ).

A series of three diagrams connected by a right-facing arrow that is labeled, “Hybridization,” and a downward-facing arrow labeled, “Gives a trigonal planar arrangement,” are shown. The first diagram shows a blue spherical orbital and two red, peanut-shaped orbitals, each placed on an X, Y, Z axis system. The two red orbitals are located on the x and z axes, respectively. The second diagram shows the same three orbitals, but they are now purple and have one enlarged lobe and one smaller lobe. Each lies in a different axis in the drawing. The third diagram shows the same three orbitals, but their smaller lobes now overlap while their larger lobes are located at and labeled as “120 degrees” from one another.
The hybridization of an s orbital (blue) and two p orbitals (red) produces three equivalent sp 2 hybridized orbitals (purple) oriented at 120° with respect to each other. The remaining unhybridized p orbital is not shown here, but is located along the z axis.

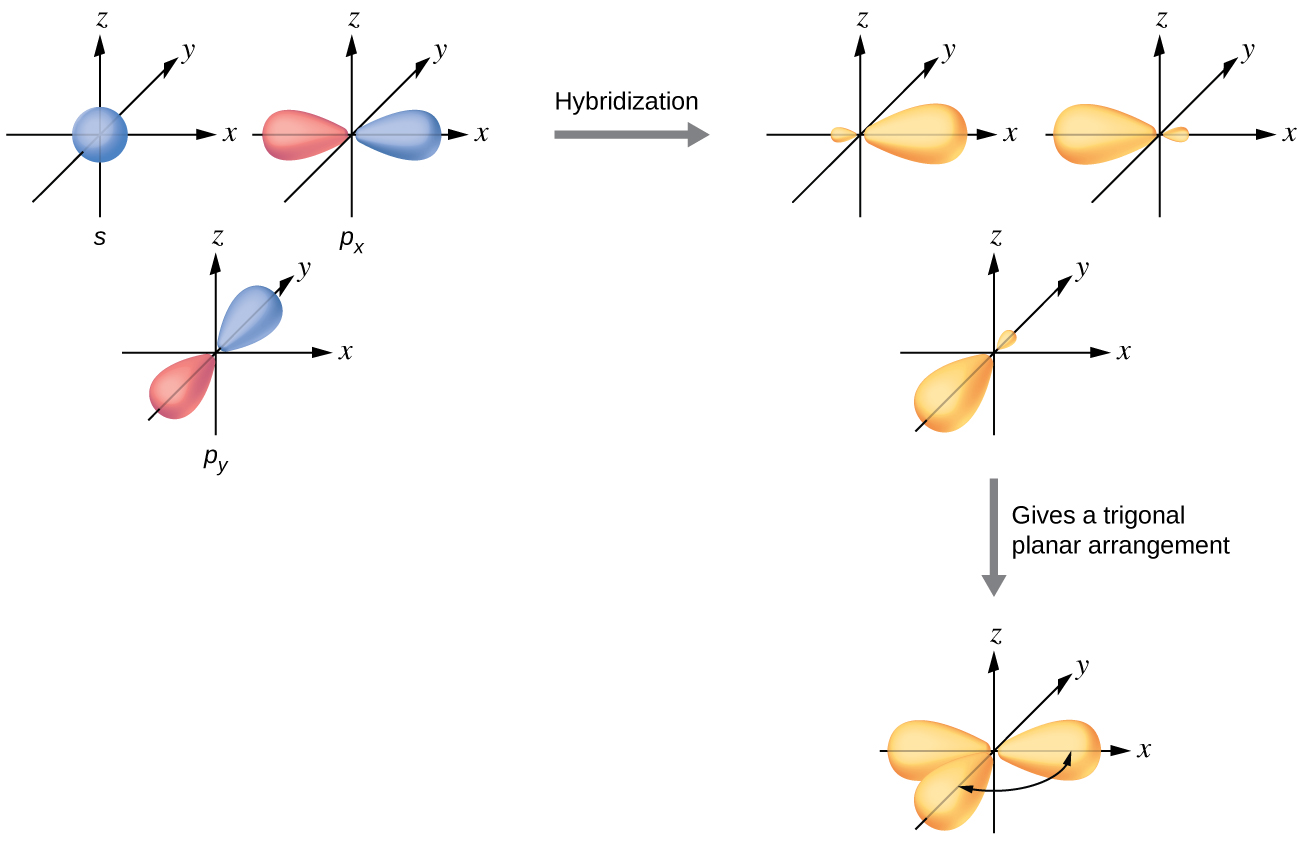
Although quantum mechanics yields the “plump” orbital lobes as depicted in [link] , sometimes for clarity these orbitals are drawn thinner and without the minor lobes, as in [link] , to avoid obscuring other features of a given illustration. We will use these “thinner” representations whenever the true view is too crowded to easily visualize.

Three balloon-like orbitals are shown, and connect together near their narrower ends in one plane. The angle between a pair of lobes is labeled, “120 degrees.”
This alternate way of drawing the trigonal planar sp 2 hybrid orbitals is sometimes used in more crowded figures.

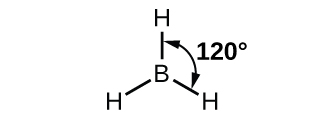
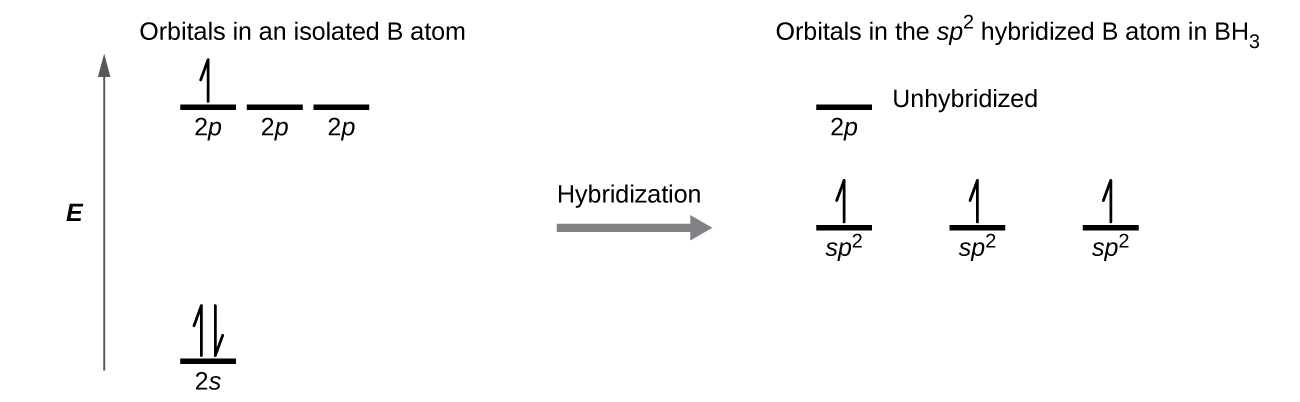
The observed structure of the borane molecule, BH 3, suggests sp 2 hybridization for boron in this compound. The molecule is trigonal planar, and the boron atom is involved in three bonds to hydrogen atoms ( [link] ). We can illustrate the comparison of orbitals and electron distribution in an isolated boron atom and in the bonded atom in BH 3 as shown in the orbital energy level diagram in [link] . We redistribute the three valence electrons of the boron atom in the three sp 2 hybrid orbitals, and each boron electron pairs with a hydrogen electron when B–H bonds form.

A boron atom is shown connected to three hydrogen atoms, which are arranged around it like a pyramid. The angle from one line connecting the boron atom to a hydrogen atom to another line connecting the boron atom to a hydrogen atom is labeled, “120 degrees.”
BH 3 is an electron-deficient molecule with a trigonal planar structure.
A diagram is shown in two parts, connected by a right facing arrow labeled, “Hybridization.” The left diagram shows an up-facing arrow labeled “E.” To the lower right of the arrow is a short, horizontal line labeled, “2 s,” that has two vertical half-arrows facing up and down on it. To the upper right of the arrow are a series of three short, horizontal lines labeled, “2 p.” Above both sets of these lines is the phrase, “Orbitals in an isolated B atom.” One of the lines has a vertical, up-facing arrow drawn on it. The right side of the diagram shows three short, horizontal lines placed halfway up the space and each labeled, “s p superscript 2.” An upward-facing half arrow is drawn vertically on each line. Above these lines is one other short, horizontal line, labeled, “2 p.” Above both sets of lines is the phrase, “Orbitals in the s p superscript 2 hybridized B atom in B H subscript 3.”
In an isolated B atom, there are one 2 s and three 2 p valence orbitals. When boron is in a molecule with three regions of electron density, three of the orbitals hybridize and create a set of three sp 2 orbitals and one unhybridized 2 p orbital. The three half-filled hybrid orbitals each overlap with an orbital from a hydrogen atom to form three σ bonds in BH 3 .

Any central atom surrounded by three regions of electron density will exhibit sp 2 hybridization. This includes molecules with a lone pair on the central atom, such as ClNO ( [link] ), or molecules with two single bonds and a double bond connected to the central atom, as in formaldehyde, CH 2 O, and ethene, H 2 CCH 2 .

Questions & Answers

Ayele, K., 2003. Introductory Economics, 3rd ed., Addis Ababa.
Widad Reply
can you send the book attached ?
Ariel
?
Ariel
What is economics
Widad Reply
the study of how humans make choices under conditions of scarcity
AI-Robot
U(x,y) = (x×y)1/2 find mu of x for y
Desalegn Reply
U(x,y) = (x×y)1/2 find mu of x for y
Desalegn
what is ecnomics
Jan Reply
this is the study of how the society manages it's scarce resources
Belonwu
what is macroeconomic
John Reply
macroeconomic is the branch of economics which studies actions, scale, activities and behaviour of the aggregate economy as a whole.
husaini
etc
husaini
difference between firm and industry
husaini Reply
what's the difference between a firm and an industry
Abdul
firm is the unit which transform inputs to output where as industry contain combination of firms with similar production 😅😅
Abdulraufu
Suppose the demand function that a firm faces shifted from Qd  120 3P to Qd  90  3P and the supply function has shifted from QS  20  2P to QS 10  2P . a) Find the effect of this change on price and quantity. b) Which of the changes in demand and supply is higher?
Toofiq Reply
explain standard reason why economic is a science
innocent Reply
factors influencing supply
Petrus Reply
what is economic.
Milan Reply
scares means__________________ends resources. unlimited
Jan
economics is a science that studies human behaviour as a relationship b/w ends and scares means which have alternative uses
Jan
calculate the profit maximizing for demand and supply
Zarshad Reply
Why qualify 28 supplies
Milan
what are explicit costs
Nomsa Reply
out-of-pocket costs for a firm, for example, payments for wages and salaries, rent, or materials
AI-Robot
concepts of supply in microeconomics
David Reply
economic overview notes
Amahle Reply
identify a demand and a supply curve
Salome Reply
i don't know
Parul
there's a difference
Aryan
Demand curve shows that how supply and others conditions affect on demand of a particular thing and what percent demand increase whith increase of supply of goods
Israr
Hi Sir please how do u calculate Cross elastic demand and income elastic demand?
Abari
Got questions? Join the online conversation and get instant answers!
Jobilize.com Reply
Practice Key Terms 7

Get Jobilize Job Search Mobile App in your pocket Now!

Get it on Google Play Download on the App Store Now


Source:  OpenStax, Chemistry. OpenStax CNX. May 20, 2015 Download for free at http://legacy.cnx.org/content/col11760/1.9
Google Play and the Google Play logo are trademarks of Google Inc.

Notification Switch

Would you like to follow the 'Chemistry' conversation and receive update notifications?

Ask