<< Chapter < Page Chapter >> Page >

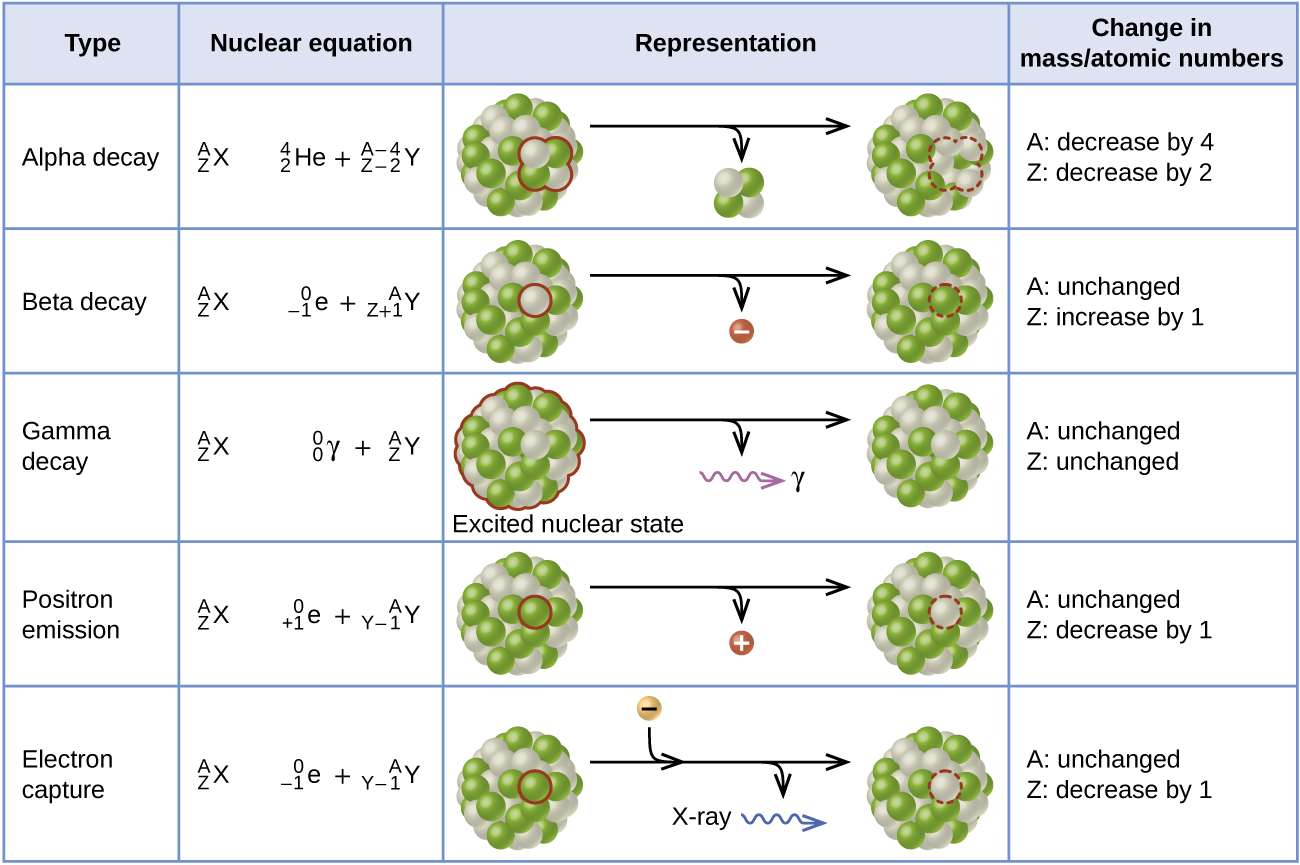
[link] summarizes these types of decay, along with their equations and changes in atomic and mass numbers.

This table has four columns and six rows. The first row is a header row and it labels each column: “Type,” “Nuclear equation,” “Representation,” and “Change in mass / atomic numbers.” Under the “Type” column are the following: “Alpha decay,” “Beta decay,” “Gamma decay,” “Positron emission,” and “Electron capture.” Under the “Nuclear equation” column are several equations. Each begins with superscript A stacked over subscript Z X. There is a large gap of space and then the following equations: “superscript 4 stacked over subscript 2 He plus superscript A minus 4 stacked over subscript Z minus 2 Y,” “superscript 0 stacked over subscript negative 1 e plus superscript A stacked over subscript Z plus 1 Y,” “superscript 0 stacked over subscript 0 lowercase gamma plus superscript A stacked over subscript Z Y,” “superscript 0 stacked over subscript positive 1 e plus superscript A stacked over subscript Y minus 1 Y,” and “superscript 0 stacked over subscript negative 1 e plus superscript A stacked over subscript Y minus 1 Y.” Under the “Representation” column are the five diagrams. The first shows a cluster of green and white spheres. A section of the cluster containing two white and two green spheres is outlined. There is a right-facing arrow pointing to a similar cluster as previously described, but the outlined section is missing. From the arrow another arrow branches off and points downward. The small cluster to two white spheres and two green spheres appear at the end of the arrow. The next diagram shows the same cluster of white and green spheres. One white sphere is outlined. There is a right-facing arrow to a similar cluster, but the white sphere is missing. Another arrow branches off the main arrow and a red sphere with a negative sign appears at the end. The next diagram shows the same cluster of white and green spheres. The whole sphere is outlined and labeled, “excited nuclear state.” There is a right-facing arrow that points to the same cluster. No spheres are missing. Off the main arrow is another arrow which points to a purple squiggle arrow which in turn points to a lowercase gamma. The next diagram shows the same cluster of white and green spheres. One green sphere is outlined. There is a right-facing arrow to a similar cluster, but the green sphere is missing. Another arrow branches off the main arrow and a red sphere with a positive sign appears at the end. The next diagram shows the same cluster of white and green spheres. One green sphere is outlined. There is a right-facing arrow to a similar cluster, but the green sphere is missing. Two other arrows branch off the main arrow. The first shows a gold sphere with a negative sign joining with the right-facing arrow. The secon points to a blue squiggle arrow labeled, “X-ray.” Under the “Change in mass / atomic numbers” column are the following: “A: decrease by 4, Z: decrease by 2,” “A: unchanged, Z: increased by 1,” “A: unchanged, Z: unchanged,” “A: unchanged, Z: unchanged,” “A: unchanged, Z: decrease by 1,” and “A: unchanged, Z: decrease by 1.”
This table summarizes the type, nuclear equation, representation, and any changes in the mass or atomic numbers for various types of decay.

Pet scan

Positron emission tomography (PET) scans use radiation to diagnose and track health conditions and monitor medical treatments by revealing how parts of a patient’s body function ( [link] ). To perform a PET scan, a positron-emitting radioisotope is produced in a cyclotron and then attached to a substance that is used by the part of the body being investigated. This “tagged” compound, or radiotracer, is then put into the patient (injected via IV or breathed in as a gas), and how it is used by the tissue reveals how that organ or other area of the body functions.

Three pictures are shown and labeled “a,” “b” and “c.” Picture a shows a machine with a round opening connected to an examination table. Picture b is a medical scan of the top of a person’s head and shows large patches of yellow and red and smaller patches of blue, green and purple highlighting. Picture c also shows a medical scan of the top of a person’s head, but this image is mostly colored in blue and purple with very small patches of red and yellow.
A PET scanner (a) uses radiation to provide an image of how part of a patient’s body functions. The scans it produces can be used to image a healthy brain (b) or can be used for diagnosing medical conditions such as Alzheimer’s disease (c). (credit a: modification of work by Jens Maus)

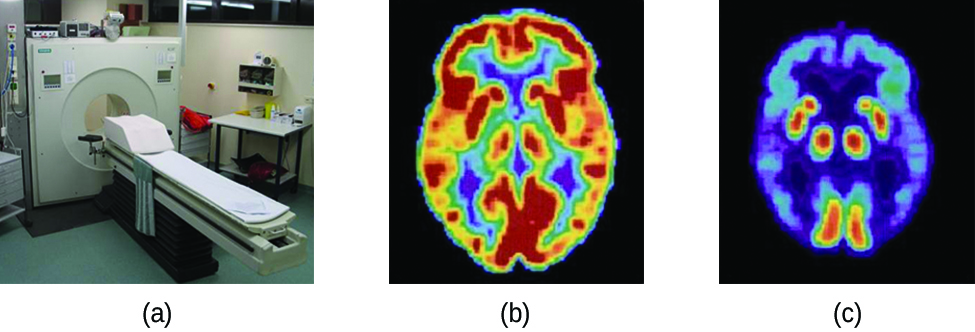
For example, F-18 is produced by proton bombardment of 18 O ( 8 18 O + 1 1 p 9 18 F + 0 1 n ) and incorporated into a glucose analog called fludeoxyglucose (FDG). How FDG is used by the body provides critical diagnostic information; for example, since cancers use glucose differently than normal tissues, FDG can reveal cancers. The 18 F emits positrons that interact with nearby electrons, producing a burst of gamma radiation. This energy is detected by the scanner and converted into a detailed, three-dimensional, color image that shows how that part of the patient’s body functions. Different levels of gamma radiation produce different amounts of brightness and colors in the image, which can then be interpreted by a radiologist to reveal what is going on. PET scans can detect heart damage and heart disease, help diagnose Alzheimer’s disease, indicate the part of a brain that is affected by epilepsy, reveal cancer, show what stage it is, and how much it has spread, and whether treatments are effective. Unlike magnetic resonance imaging and X-rays, which only show how something looks, the big advantage of PET scans is that they show how something functions. PET scans are now usually performed in conjunction with a computed tomography scan.

Radioactive decay series

The naturally occurring radioactive isotopes of the heaviest elements fall into chains of successive disintegrations, or decays, and all the species in one chain constitute a radioactive family, or radioactive decay series    . Three of these series include most of the naturally radioactive elements of the periodic table. They are the uranium series, the actinide series, and the thorium series. The neptunium series is a fourth series, which is no longer significant on the earth because of the short half-lives of the species involved. Each series is characterized by a parent (first member) that has a long half-life and a series of daughter nuclides that ultimately lead to a stable end-product—that is, a nuclide on the band of stability ( [link] ). In all three series, the end-product is a stable isotope of lead. The neptunium series, previously thought to terminate with bismuth-209, terminates with thallium-205.

Questions & Answers

how do you get the 2/50
Abba Reply
number of sport play by 50 student construct discrete data
Aminu Reply
width of the frangebany leaves on how to write a introduction
Theresa Reply
Solve the mean of variance
Veronica Reply
Step 1: Find the mean. To find the mean, add up all the scores, then divide them by the number of scores. ... Step 2: Find each score's deviation from the mean. ... Step 3: Square each deviation from the mean. ... Step 4: Find the sum of squares. ... Step 5: Divide the sum of squares by n – 1 or N.
kenneth
what is error
Yakuba Reply
Is mistake done to something
Vutshila
Hy
anas
hy
What is the life teble
anas
hy
Jibrin
statistics is the analyzing of data
Tajudeen Reply
what is statics?
Zelalem Reply
how do you calculate mean
Gloria Reply
diveving the sum if all values
Shaynaynay
let A1,A2 and A3 events be independent,show that (A1)^c, (A2)^c and (A3)^c are independent?
Fisaye Reply
what is statistics
Akhisani Reply
data collected all over the world
Shaynaynay
construct a less than and more than table
Imad Reply
The sample of 16 students is taken. The average age in the sample was 22 years with astandard deviation of 6 years. Construct a 95% confidence interval for the age of the population.
Aschalew Reply
Bhartdarshan' is an internet-based travel agency wherein customer can see videos of the cities they plant to visit. The number of hits daily is a normally distributed random variable with a mean of 10,000 and a standard deviation of 2,400 a. what is the probability of getting more than 12,000 hits? b. what is the probability of getting fewer than 9,000 hits?
Akshay Reply
Bhartdarshan'is an internet-based travel agency wherein customer can see videos of the cities they plan to visit. The number of hits daily is a normally distributed random variable with a mean of 10,000 and a standard deviation of 2,400. a. What is the probability of getting more than 12,000 hits
Akshay
1
Bright
Sorry i want to learn more about this question
Bright
Someone help
Bright
a= 0.20233 b=0.3384
Sufiyan
a
Shaynaynay
How do I interpret level of significance?
Mohd Reply
It depends on your business problem or in Machine Learning you could use ROC- AUC cruve to decide the threshold value
Shivam
how skewness and kurtosis are used in statistics
Owen Reply
yes what is it
Taneeya
Got questions? Join the online conversation and get instant answers!
Jobilize.com Reply

Get Jobilize Job Search Mobile App in your pocket Now!

Get it on Google Play Download on the App Store Now


Source:  OpenStax, Chemistry. OpenStax CNX. May 20, 2015 Download for free at http://legacy.cnx.org/content/col11760/1.9
Google Play and the Google Play logo are trademarks of Google Inc.

Notification Switch

Would you like to follow the 'Chemistry' conversation and receive update notifications?

Ask