<< Chapter < Page Chapter >> Page >

Phase diagram for an aqueous solution of a nonelectrolyte

The colligative effects on vapor pressure, boiling point, and freezing point described in the previous section are conveniently summarized by comparing the phase diagrams for a pure liquid and a solution derived from that liquid. Phase diagrams for water and an aqueous solution are shown in [link] .
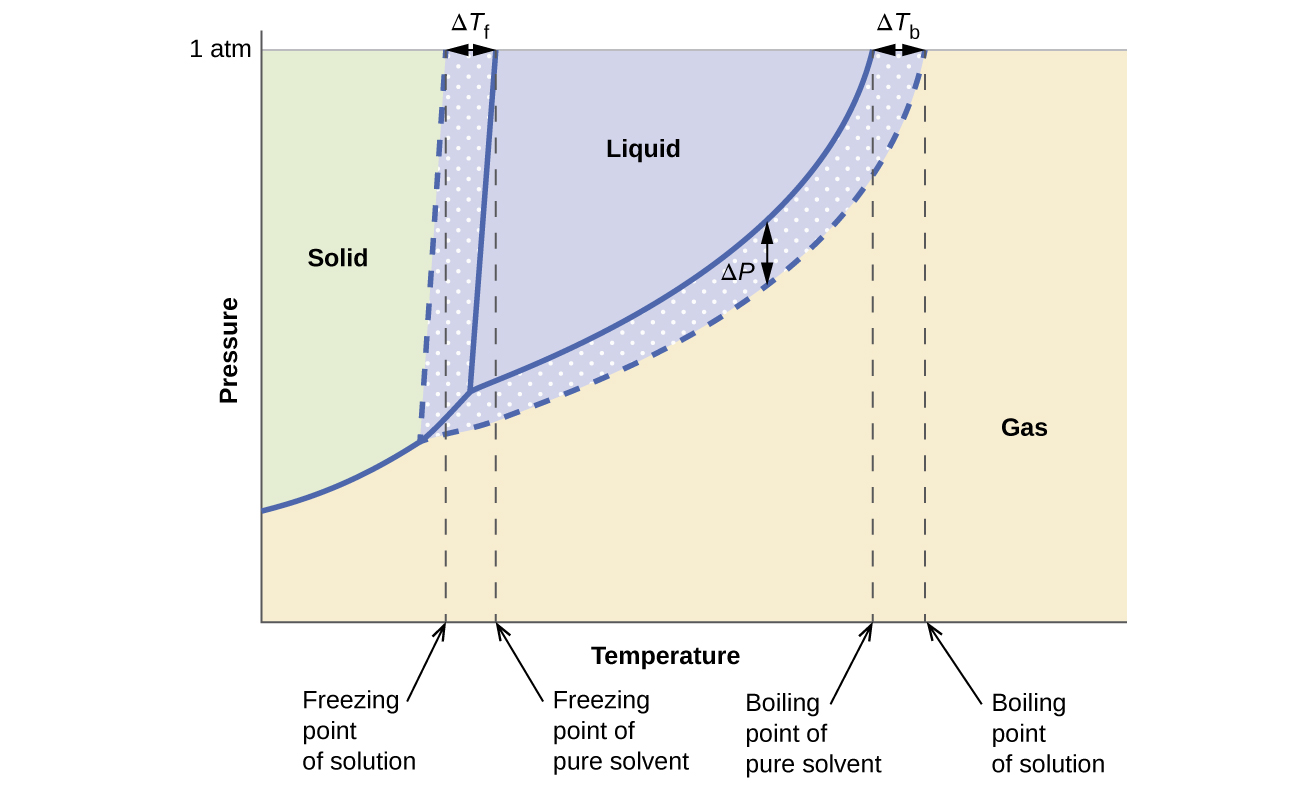
This phase diagram indicates the pressure in atmospheres of water and a solution at various temperatures. The graph shows the freezing point of water and the freezing point of the solution, with the difference between these two values identified as delta T subscript f. The graph shows the boiling point of water and the boiling point of the solution, with the difference between these two values identified as delta T subscript b. Similarly, the difference in the pressure of water and the solution at the boiling point of water is shown and identified as delta P. This difference in pressure is labeled vapor pressure lowering. The lower level of the vapor pressure curve for the solution as opposed to that of pure water shows vapor pressure lowering in the solution. Background colors on the diagram indicate the presence of water and the solution in the solid state to the left, liquid state in the central upper region, and gas to the right.
These phase diagrams show water (solid curves) and an aqueous solution of nonelectrolyte (dashed curves).

The liquid-vapor curve for the solution is located beneath the corresponding curve for the solvent, depicting the vapor pressure lowering , Δ P , that results from the dissolution of nonvolatile solute. Consequently, at any given pressure, the solution’s boiling point is observed at a higher temperature than that for the pure solvent, reflecting the boiling point elevation, Δ T b , associated with the presence of nonvolatile solute. The solid-liquid curve for the solution is displaced left of that for the pure solvent, representing the freezing point depression, Δ T b , that accompanies solution formation. Finally, notice that the solid-gas curves for the solvent and its solution are identical. This is the case for many solutions comprising liquid solvents and nonvolatile solutes. Just as for vaporization, when a solution of this sort is frozen, it is actually just the solvent molecules that undergo the liquid-to-solid transition, forming pure solid solvent that excludes solute species. The solid and gaseous phases, therefore, are composed solvent only, and so transitions between these phases are not subject to colligative effects.

Osmosis and osmotic pressure of solutions

A number of natural and synthetic materials exhibit selective permeation , meaning that only molecules or ions of a certain size, shape, polarity, charge, and so forth, are capable of passing through (permeating) the material. Biological cell membranes provide elegant examples of selective permeation in nature, while dialysis tubing used to remove metabolic wastes from blood is a more simplistic technological example. Regardless of how they may be fabricated, these materials are generally referred to as semipermeable membranes .

Consider the apparatus illustrated in [link] , in which samples of pure solvent and a solution are separated by a membrane that only solvent molecules may permeate. Solvent molecules will diffuse across the membrane in both directions. Since the concentration of solvent is greater in the pure solvent than the solution, these molecules will diffuse from the solvent side of the membrane to the solution side at a faster rate than they will in the reverse direction. The result is a net transfer of solvent molecules from the pure solvent to the solution. Diffusion-driven transfer of solvent molecules through a semipermeable membrane is a process known as osmosis    .
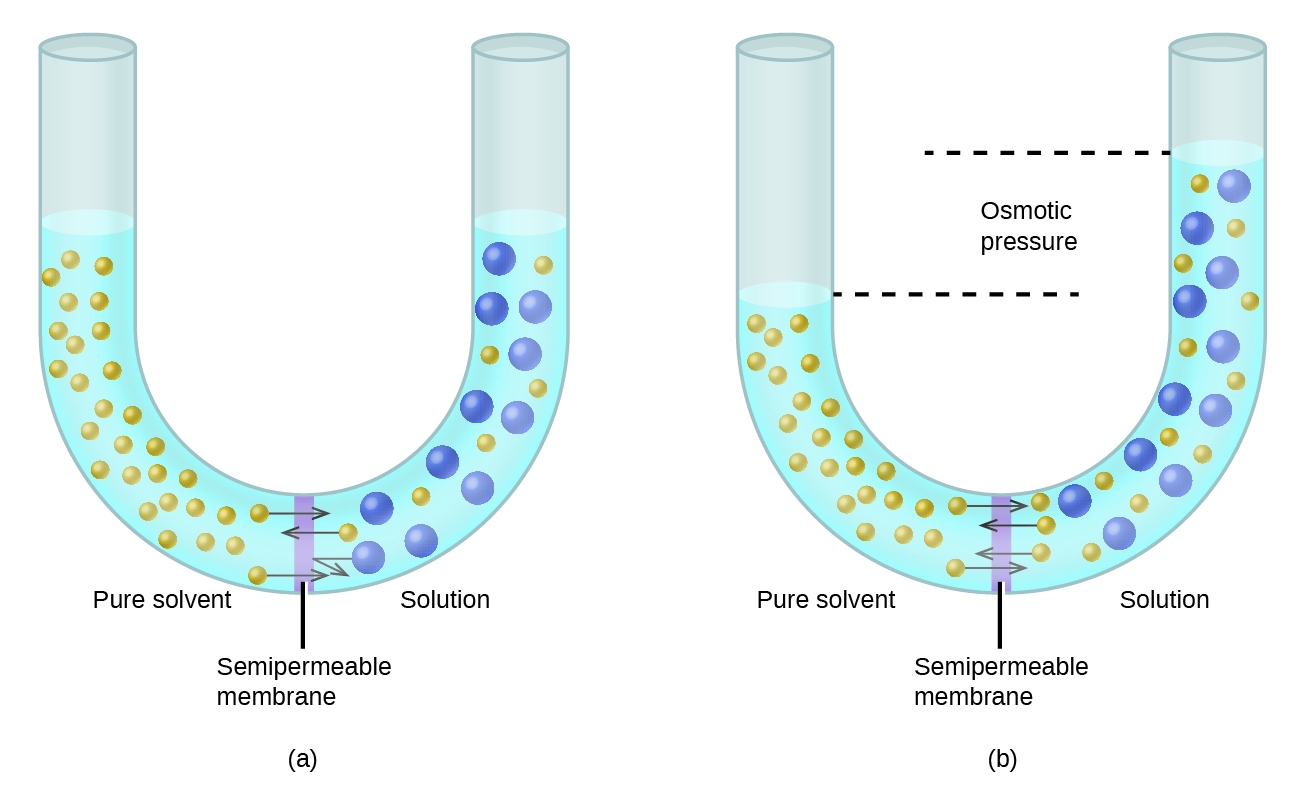
The figure shows two U shaped tubes with a semi permeable membrane placed at the base of the U. In figure a, pure solvent is present and indicated by small yellow spheres to the left of the membrane. To the right, a solution exists with larger blue spheres intermingled with some small yellow spheres. At the membrane, arrows pointing from three small yellow spheres on both sides of the membrane cross over the membrane. An arrow drawn from one of the large blue spheres does not cross the membrane, but rather is reflected back from the surface of the membrane. The levels of liquid in both sides of the U shaped tube are equal. In figure b, arrows again point from small yellow spheres across the semipermeable membrane from both sides. This diagram shows the level of liquid in the left, pure solvent, side to be significantly lower than the liquid level on the right. Dashed lines are drawn from these two liquid levels into the middle of the U-shaped tube and between them is the term osmotic pressure.
Osmosis results in the transfer of solvent molecules from a sample of low (or zero) solute concentration to a sample of higher solute concentration.

When osmosis is carried out in an apparatus like that shown in [link] , the volume of the solution increases as it becomes diluted by accumulation of solvent. This causes the level of the solution to rise, increasing its hydrostatic pressure (due to the weight of the column of solution in the tube) and resulting in a faster transfer of solvent molecules back to the pure solvent side. When the pressure reaches a value that yields a reverse solvent transfer rate equal to the osmosis rate, bulk transfer of solvent ceases. This pressure is called the osmotic pressure ( Π )    of the solution. The osmotic pressure of a dilute solution is related to its solute molarity, M , and absolute temperature, T , according to the equation

Questions & Answers

how do you get the 2/50
Abba Reply
number of sport play by 50 student construct discrete data
Aminu Reply
width of the frangebany leaves on how to write a introduction
Theresa Reply
Solve the mean of variance
Veronica Reply
Step 1: Find the mean. To find the mean, add up all the scores, then divide them by the number of scores. ... Step 2: Find each score's deviation from the mean. ... Step 3: Square each deviation from the mean. ... Step 4: Find the sum of squares. ... Step 5: Divide the sum of squares by n – 1 or N.
kenneth
what is error
Yakuba Reply
Is mistake done to something
Vutshila
Hy
anas
hy
What is the life teble
anas
hy
Jibrin
statistics is the analyzing of data
Tajudeen Reply
what is statics?
Zelalem Reply
how do you calculate mean
Gloria Reply
diveving the sum if all values
Shaynaynay
let A1,A2 and A3 events be independent,show that (A1)^c, (A2)^c and (A3)^c are independent?
Fisaye Reply
what is statistics
Akhisani Reply
data collected all over the world
Shaynaynay
construct a less than and more than table
Imad Reply
The sample of 16 students is taken. The average age in the sample was 22 years with astandard deviation of 6 years. Construct a 95% confidence interval for the age of the population.
Aschalew Reply
Bhartdarshan' is an internet-based travel agency wherein customer can see videos of the cities they plant to visit. The number of hits daily is a normally distributed random variable with a mean of 10,000 and a standard deviation of 2,400 a. what is the probability of getting more than 12,000 hits? b. what is the probability of getting fewer than 9,000 hits?
Akshay Reply
Bhartdarshan'is an internet-based travel agency wherein customer can see videos of the cities they plan to visit. The number of hits daily is a normally distributed random variable with a mean of 10,000 and a standard deviation of 2,400. a. What is the probability of getting more than 12,000 hits
Akshay
1
Bright
Sorry i want to learn more about this question
Bright
Someone help
Bright
a= 0.20233 b=0.3384
Sufiyan
a
Shaynaynay
How do I interpret level of significance?
Mohd Reply
It depends on your business problem or in Machine Learning you could use ROC- AUC cruve to decide the threshold value
Shivam
how skewness and kurtosis are used in statistics
Owen Reply
yes what is it
Taneeya
Got questions? Join the online conversation and get instant answers!
Jobilize.com Reply

Get Jobilize Job Search Mobile App in your pocket Now!

Get it on Google Play Download on the App Store Now


Source:  OpenStax, Chemistry. OpenStax CNX. May 20, 2015 Download for free at http://legacy.cnx.org/content/col11760/1.9
Google Play and the Google Play logo are trademarks of Google Inc.

Notification Switch

Would you like to follow the 'Chemistry' conversation and receive update notifications?

Ask