

| << Chapter < Page | Chapter >> Page > |
Other significant industrial processes that involve the use of heterogeneous catalysts include the preparation of sulfuric acid, the preparation of ammonia, the oxidation of ammonia to nitric acid, and the synthesis of methanol, CH 3 OH. Heterogeneous catalysts are also used in the catalytic converters found on most gasoline-powered automobiles ( [link] ).
Scientists developed catalytic converters to reduce the amount of toxic emissions produced by burning gasoline in internal combustion engines. Catalytic converters take advantage of all five factors that affect the speed of chemical reactions to ensure that exhaust emissions are as safe as possible.
By utilizing a carefully selected blend of catalytically active metals, it is possible to effect complete combustion of all carbon-containing compounds to carbon dioxide while also reducing the output of nitrogen oxides. This is particularly impressive when we consider that one step involves adding more oxygen to the molecule and the other involves removing the oxygen ( [link] ).
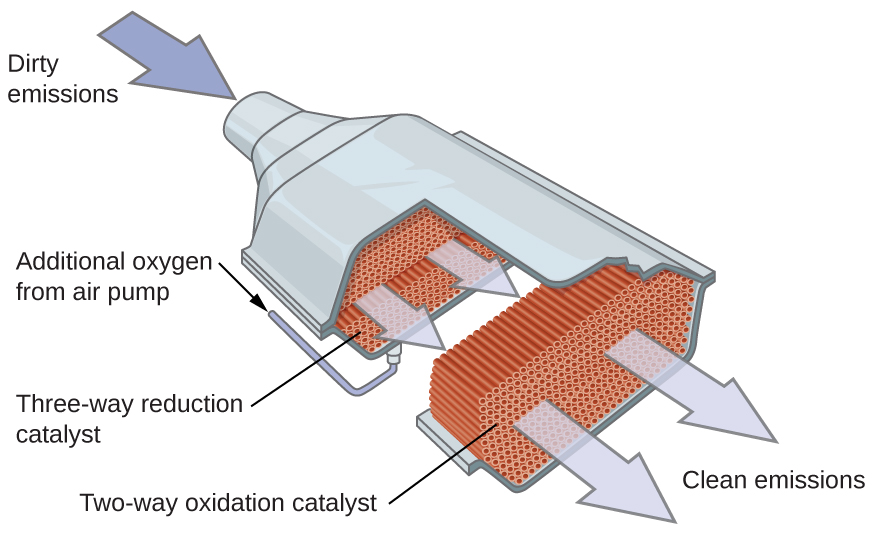
Most modern, three-way catalytic converters possess a surface impregnated with a platinum-rhodium catalyst, which catalyzes the conversion nitric oxide into dinitrogen and oxygen as well as the conversion of carbon monoxide and hydrocarbons such as octane into carbon dioxide and water vapor:
In order to be as efficient as possible, most catalytic converters are preheated by an electric heater. This ensures that the metals in the catalyst are fully active even before the automobile exhaust is hot enough to maintain appropriate reaction temperatures.
The University of California at Davis’ “ChemWiki” provides a thorough explanation of how catalytic converters work.
The study of enzymes is an important interconnection between biology and chemistry. Enzymes are usually proteins (polypeptides) that help to control the rate of chemical reactions between biologically important compounds, particularly those that are involved in cellular metabolism. Different classes of enzymes perform a variety of functions, as shown in [link] .
| Classes of Enzymes and Their Functions | |
|---|---|
| Class | Function |
| oxidoreductases | redox reactions |
| transferases | transfer of functional groups |
| hydrolases | hydrolysis reactions |
| lyases | group elimination to form double bonds |
| isomerases | isomerization |
| ligases | bond formation with ATP hydrolysis |
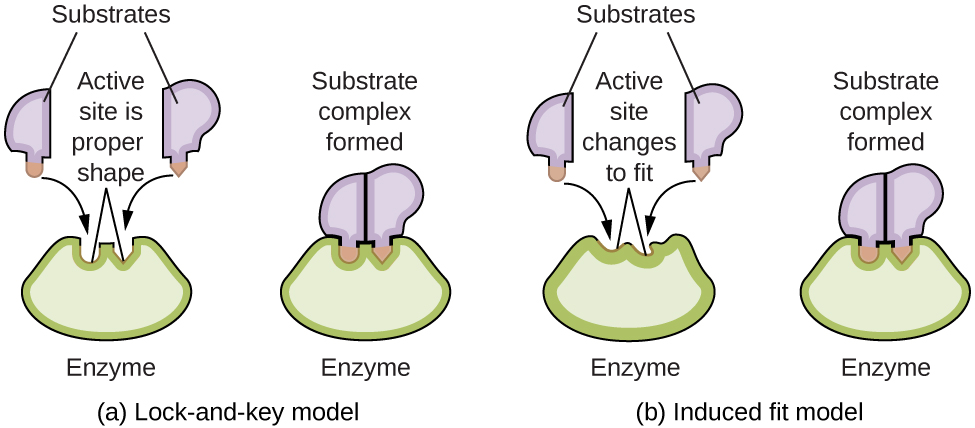
Enzyme molecules possess an active site, a part of the molecule with a shape that allows it to bond to a specific substrate (a reactant molecule), forming an enzyme-substrate complex as a reaction intermediate. There are two models that attempt to explain how this active site works. The most simplistic model is referred to as the lock-and-key hypothesis, which suggests that the molecular shapes of the active site and substrate are complementary, fitting together like a key in a lock. The induced fit hypothesis, on the other hand, suggests that the enzyme molecule is flexible and changes shape to accommodate a bond with the substrate. This is not to suggest that an enzyme’s active site is completely malleable, however. Both the lock-and-key model and the induced fit model account for the fact that enzymes can only bind with specific substrates, since in general a particular enzyme only catalyzes a particular reaction ( [link] ).
The Royal Society of Chemistry provides an excellent introduction to enzymes for students and teachers.
Catalysts affect the rate of a chemical reaction by altering its mechanism to provide a lower activation energy. Catalysts can be homogenous (in the same phase as the reactants) or heterogeneous (a different phase than the reactants).
Account for the increase in reaction rate brought about by a catalyst.
The general mode of action for a catalyst is to provide a mechanism by which the reactants can unite more readily by taking a path with a lower reaction energy. The rates of both the forward and the reverse reactions are increased, leading to a faster achievement of equilibrium.
Compare the functions of homogeneous and heterogeneous catalysts.
Consider this scenario and answer the following questions: Chlorine atoms resulting from decomposition of chlorofluoromethanes, such as CCl
2 F
2 , catalyze the decomposition of ozone in the atmosphere. One simplified mechanism for the decomposition is:
(a) Explain why chlorine atoms are catalysts in the gas-phase transformation:
(b) Nitric oxide is also involved in the decomposition of ozone by the mechanism:
Is NO a catalyst for the decomposition? Explain your answer.
(a) Chlorine atoms are a catalyst because they react in the second step but are regenerated in the third step. Thus, they are not used up, which is a characteristic of catalysts. (b) NO is a catalyst for the same reason as in part (a).
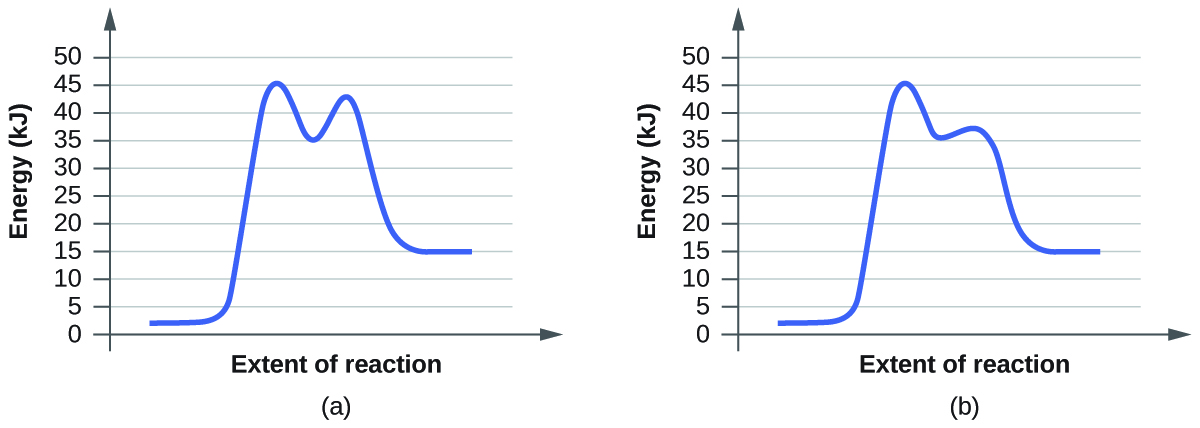
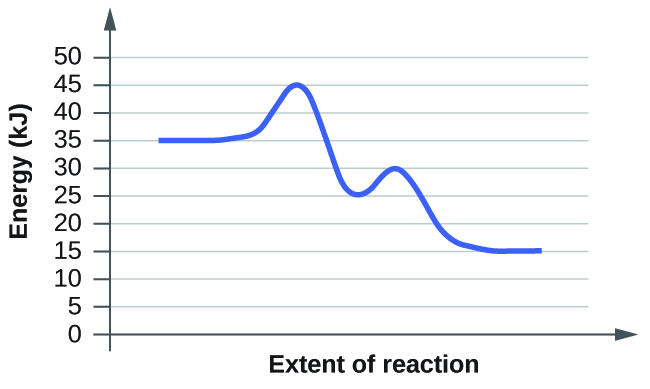
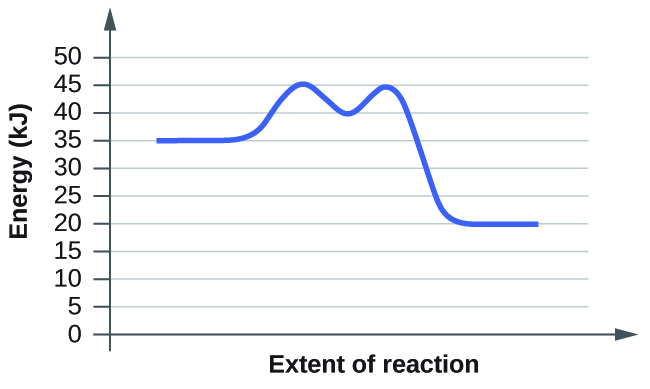
For each of the following pairs of reaction diagrams, identify which of the pair is catalyzed:
(a)
(b)
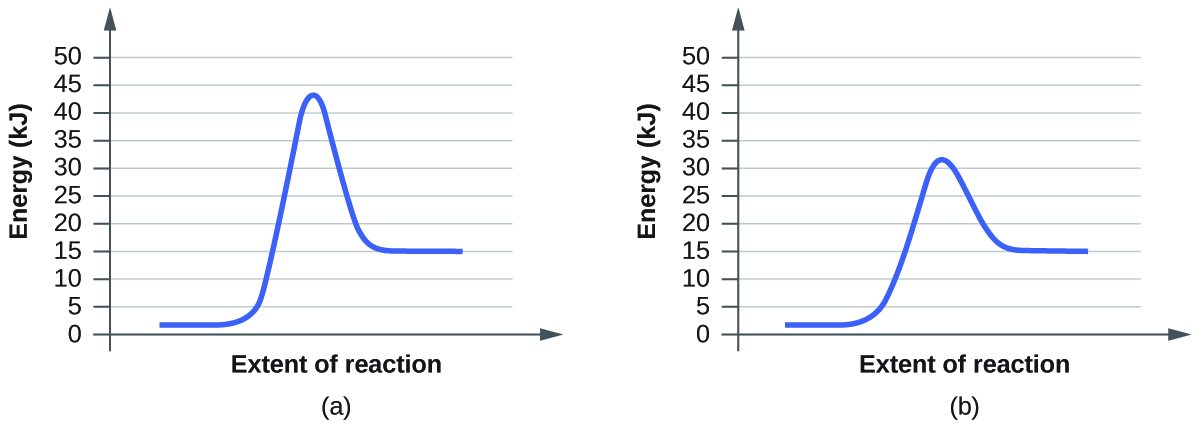
For each of the following pairs of reaction diagrams, identify which of the pairs is catalyzed:
(a)
(b)
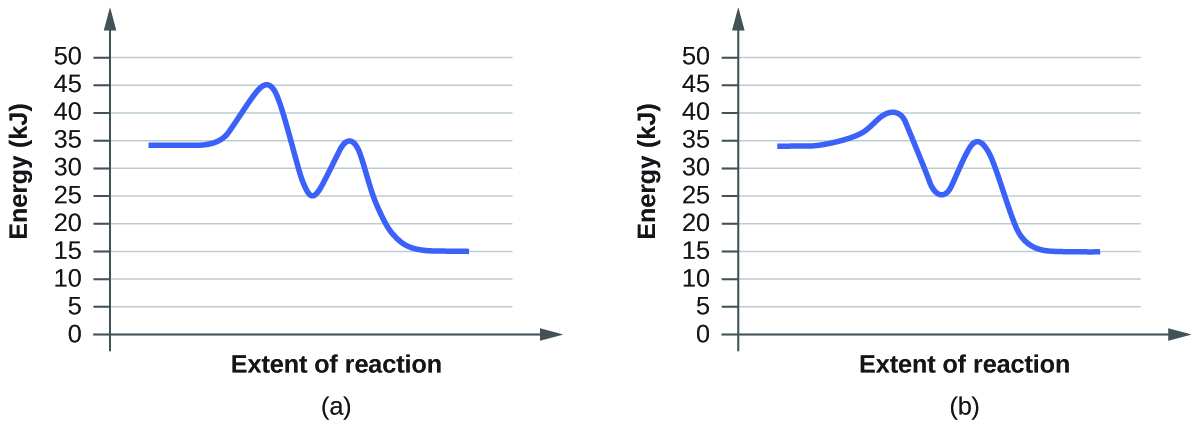
The lowering of the transition state energy indicates the effect of a catalyst. (a) A; (b) B
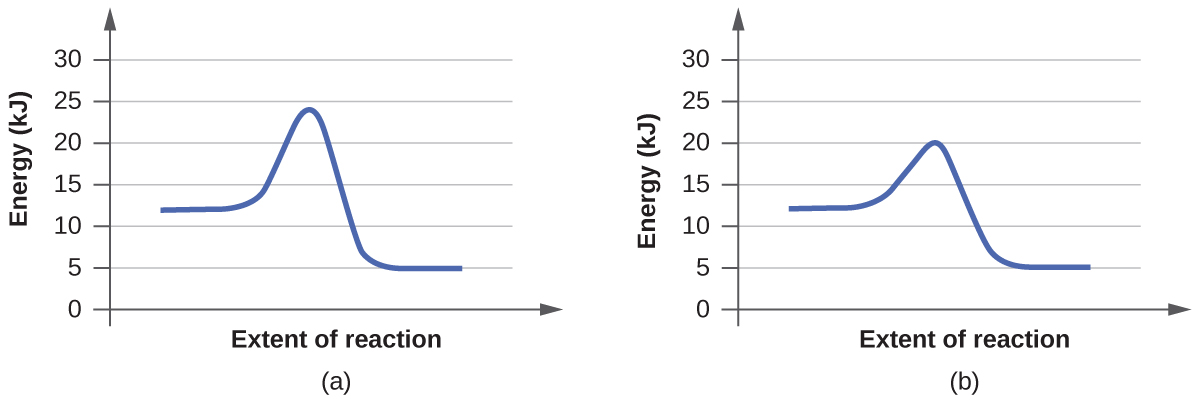
For each of the following reaction diagrams, estimate the activation energy ( E a ) of the reaction:
(a)
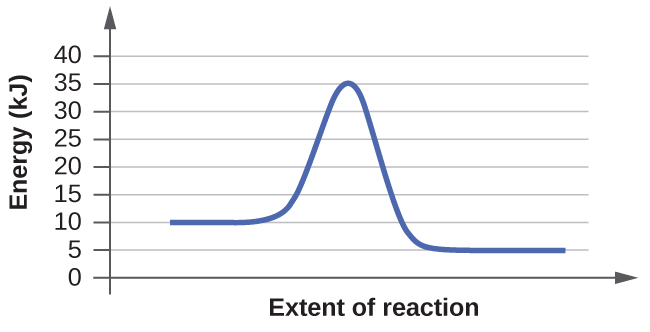
(b)
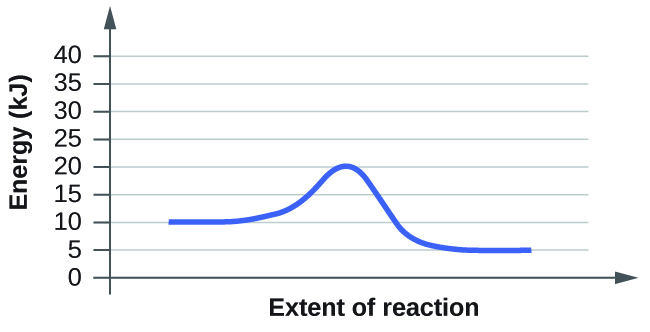
For each of the following reaction diagrams, estimate the activation energy ( E a ) of the reaction:
(a)
(b)
The energy needed to go from the initial state to the transition state is (a) 10 kJ; (b) 10 kJ
Based on the diagrams in [link] , which of the reactions has the fastest rate? Which has the slowest rate?
Based on the diagrams in [link] , which of the reactions has the fastest rate? Which has the slowest rate?
Both have the same activation energy, so they also have the same rate.
Notification Switch
Would you like to follow the 'Chemistry' conversation and receive update notifications?

|
|
|
|
|

|
|

|
|

|
|

|
|

|
|

|
|

|
|

|
|

|
|

|