<< Chapter < Page Chapter >> Page >
Δ G = Δ H T Δ S
y = b + m x

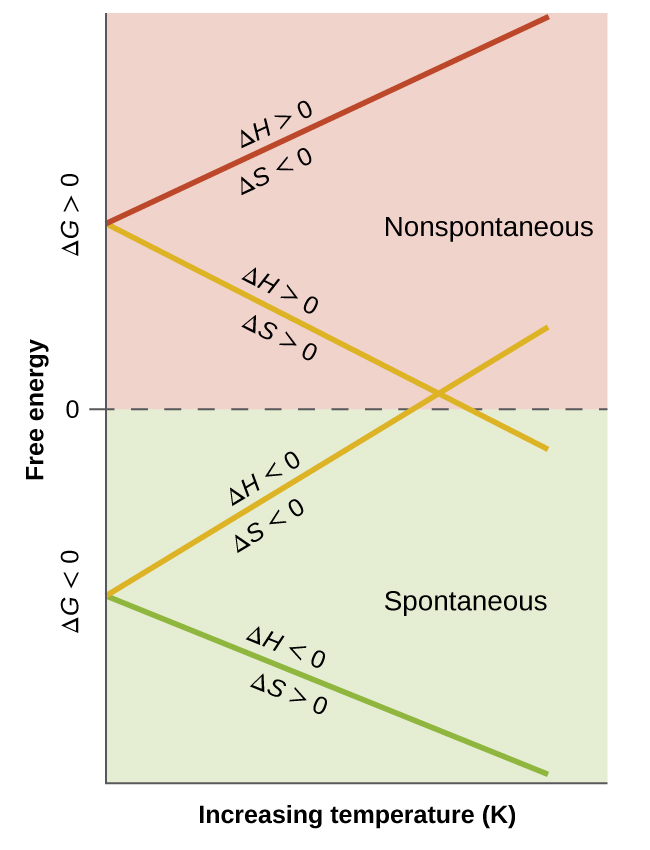
Such a plot is shown in [link] . A process whose enthalpy and entropy changes are of the same arithmetic sign will exhibit a temperature-dependent spontaneity as depicted by the two yellow lines in the plot. Each line crosses from one spontaneity domain (positive or negative Δ G ) to the other at a temperature that is characteristic of the process in question. This temperature is represented by the x -intercept of the line, that is, the value of T for which Δ G is zero:

Δ G = 0 = Δ H T Δ S
T = Δ H Δ S

And so, saying a process is spontaneous at “high” or “low” temperatures means the temperature is above or below, respectively, that temperature at which Δ G for the process is zero. As noted earlier, this condition describes a system at equilibrium.

A graph is shown where the y-axis is labeled, “Free energy,” and the x-axis is labeled, “Increasing temperature ( K ).” The value of zero is written midway up the y-axis with the label, “delta G greater than 0,” written above this line and, “delta G less than 0,” written below it. The bottom half of the graph is labeled on the right as, “Spontaneous,” and the top half is labeled on the right as, “Nonspontaneous.” A green line labeled, “delta H less than 0, delta S greater than 0,” extends from a quarter of the way up the y-axis to the bottom right of the graph. A yellow line labeled, “delta H less than 0, delta S less than 0,” extends from a quarter of the way up the y-axis to the middle right of the graph. A second yellow line labeled, “delta H greater than 0, delta S greater than 0,” extends from three quarters of the way up the y-axis to the middle right of the graph. A red line labeled, “delta H greater than 0, delta S less than 0,” extends from three quarters of the way up the y-axis to the top right of the graph.
These plots show the variation in Δ G with temperature for the four possible combinations of arithmetic sign for Δ H and Δ S .

Equilibrium temperature for a phase transition

As defined in the chapter on liquids and solids, the boiling point of a liquid is the temperature at which its solid and liquid phases are in equilibrium (that is, when vaporization and condensation occur at equal rates). Use the information in Appendix G to estimate the boiling point of water.

Solution

The process of interest is the following phase change:

H 2 O ( l ) H 2 O ( g )

When this process is at equilibrium, Δ G = 0, so the following is true:

0 = Δ H ° T Δ S ° or T = Δ H ° Δ S °

Using the standard thermodynamic data from Appendix G ,

Δ H ° = Δ H f ° ( H 2 O ( g ) ) Δ H f ° ( H 2 O ( l ) ) = 241.82 kJ/mol ( 285.83 kJ/mol ) = 44.01 kJ/mol
Δ S ° = Δ S 298 ° ( H 2 O ( g ) ) Δ S 298 ° ( H 2 O ( l ) ) = 188.8 J/K·mol 70.0 J/K·mol = 118.8 J/K·mol
T = Δ H ° Δ S ° = 44.01 × 10 3 J/mol 118.8 J/K·mol = 370.5 K = 97.3 °C

The accepted value for water’s normal boiling point is 373.2 K (100.0 °C), and so this calculation is in reasonable agreement. Note that the values for enthalpy and entropy changes data used were derived from standard data at 298 K ( Appendix G ). If desired, you could obtain more accurate results by using enthalpy and entropy changes determined at (or at least closer to) the actual boiling point.

Check your learning

Use the information in Appendix G to estimate the boiling point of CS 2 .

Answer:

313 K (accepted value 319 K)

Got questions? Get instant answers now!

Free energy and equilibrium

The free energy change for a process may be viewed as a measure of its driving force. A negative value for Δ G represents a finite driving force for the process in the forward direction, while a positive value represents a driving force for the process in the reverse direction. When Δ G is zero, the forward and reverse driving forces are equal, and so the process occurs in both directions at the same rate (the system is at equilibrium).

In the chapter on equilibrium the reaction quotient , Q , was introduced as a convenient measure of the status of an equilibrium system. Recall that Q is the numerical value of the mass action expression for the system, and that you may use its value to identify the direction in which a reaction will proceed in order to achieve equilibrium. When Q is lesser than the equilibrium constant, K , the reaction will proceed in the forward direction until equilibrium is reached and Q = K . Conversely, if Q < K , the process will proceed in the reverse direction until equilibrium is achieved.

Questions & Answers

how do you get the 2/50
Abba Reply
number of sport play by 50 student construct discrete data
Aminu Reply
width of the frangebany leaves on how to write a introduction
Theresa Reply
Solve the mean of variance
Veronica Reply
Step 1: Find the mean. To find the mean, add up all the scores, then divide them by the number of scores. ... Step 2: Find each score's deviation from the mean. ... Step 3: Square each deviation from the mean. ... Step 4: Find the sum of squares. ... Step 5: Divide the sum of squares by n – 1 or N.
kenneth
what is error
Yakuba Reply
Is mistake done to something
Vutshila
Hy
anas
hy
What is the life teble
anas
hy
Jibrin
statistics is the analyzing of data
Tajudeen Reply
what is statics?
Zelalem Reply
how do you calculate mean
Gloria Reply
diveving the sum if all values
Shaynaynay
let A1,A2 and A3 events be independent,show that (A1)^c, (A2)^c and (A3)^c are independent?
Fisaye Reply
what is statistics
Akhisani Reply
data collected all over the world
Shaynaynay
construct a less than and more than table
Imad Reply
The sample of 16 students is taken. The average age in the sample was 22 years with astandard deviation of 6 years. Construct a 95% confidence interval for the age of the population.
Aschalew Reply
Bhartdarshan' is an internet-based travel agency wherein customer can see videos of the cities they plant to visit. The number of hits daily is a normally distributed random variable with a mean of 10,000 and a standard deviation of 2,400 a. what is the probability of getting more than 12,000 hits? b. what is the probability of getting fewer than 9,000 hits?
Akshay Reply
Bhartdarshan'is an internet-based travel agency wherein customer can see videos of the cities they plan to visit. The number of hits daily is a normally distributed random variable with a mean of 10,000 and a standard deviation of 2,400. a. What is the probability of getting more than 12,000 hits
Akshay
1
Bright
Sorry i want to learn more about this question
Bright
Someone help
Bright
a= 0.20233 b=0.3384
Sufiyan
a
Shaynaynay
How do I interpret level of significance?
Mohd Reply
It depends on your business problem or in Machine Learning you could use ROC- AUC cruve to decide the threshold value
Shivam
how skewness and kurtosis are used in statistics
Owen Reply
yes what is it
Taneeya
Got questions? Join the online conversation and get instant answers!
Jobilize.com Reply
Practice Key Terms 3

Get Jobilize Job Search Mobile App in your pocket Now!

Get it on Google Play Download on the App Store Now


Source:  OpenStax, Chemistry. OpenStax CNX. May 20, 2015 Download for free at http://legacy.cnx.org/content/col11760/1.9
Google Play and the Google Play logo are trademarks of Google Inc.

Notification Switch

Would you like to follow the 'Chemistry' conversation and receive update notifications?

Ask