<< Chapter < Page Chapter >> Page >
This figure shows four one-dimensional standing waves. The waves are shown in a tan color and are composed of curves to represent standing waves that can be generated using string. The first image at the top of the figure shows a single long wave with no nodes, or points where the string appears to cross between the endpoints at the left and right sides of the figure. The second diagram just below shows a single node at the center of the wave, which divides the wave into two identical halves to the left and right. The third diagram shows two nodes, dividing the image into three identical parts to the left, center, and right. Similarly, the last image at the bottom of the figure shows three nodes, dividing the image into four identical parts.
A vibrating string shows some one-dimensional standing waves. Since the two end points of the string are held fixed, only waves having an integer number of half-wavelengths can form. The points on the string between the end points that are not moving are called the nodes.

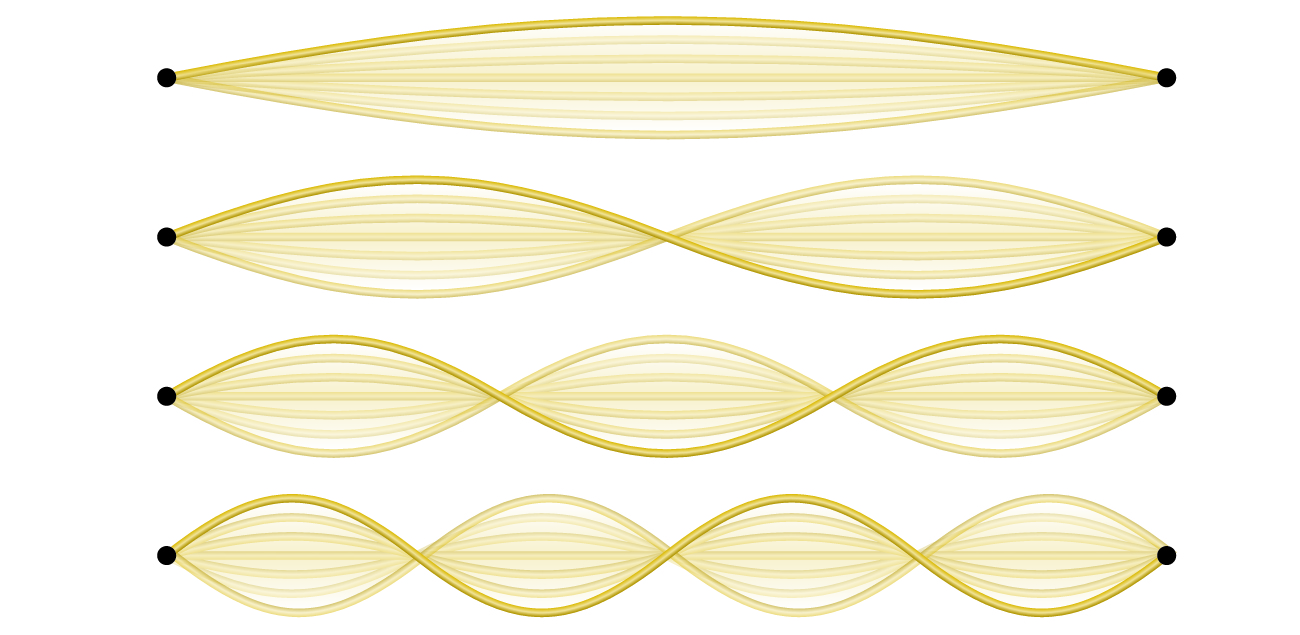
An example of two-dimensional standing waves is shown in [link] , which shows the vibrational patterns on a flat surface. Although the vibrational amplitudes cannot be seen like they could in the vibrating string, the nodes have been made visible by sprinkling the drum surface with a powder that collects on the areas of the surface that have minimal displacement. For one-dimensional standing waves, the nodes were points on the line, but for two-dimensional standing waves, the nodes are lines on the surface (for three-dimensional standing waves, the nodes are two-dimensional surfaces within the three-dimensional volume). Because of the circular symmetry of the drum surface, its boundary conditions (the drum surface being tightly constrained to the circumference of the drum) result in two types of nodes: radial nodes that sweep out all angles at constant radii and, thus, are seen as circles about the center, and angular nodes that sweep out all radii at constant angles and, thus, are seen as lines passing through the center. The upper left image in [link] shows two radial nodes, while the image in the lower right shows the vibrational pattern associated with three radial nodes and two angular nodes.

This figure includes four images. In each image, a brown circular platform has been sprinkled with a tan powder, yellow wires connect to a cylindrical base beneath the platform. To the right of the platform is a white box with a blue front which is labeled, “5.289 k H z Function Generator.” The image in the top left shows three distinct rings formed from the tan powder evenly spaced from the center of the platform, with the first ring very close to the center of the platform. The box reads, “2.434 k H z.” The image in the top right is similar except that the rings are closer together and the central ring has a significantly greater radius than in the first diagram. In this photo, the box reads, “3.986 k H z.” The image at the lower left is similar to the image in the upper left except that more of the powder is present, and 8 evenly-spaced radii are formed from the tan powder on the platform, making a web-like image. In this photo, the box reads, “5.289 k H z.” In the lower right of the figure, the image is similar to what is shown in the upper right except that four evenly spaced radii are shown composed of the tan powder on the platform. In this photo, the box reads, “5.670 K H z.”
Two-dimensional standing waves can be visualized on a vibrating surface. The surface has been sprinkled with a powder that collects near the nodal lines. There are two types of nodes visible: radial nodes (circles) and angular nodes (radii).

Blackbody radiation and the ultraviolet catastrophe

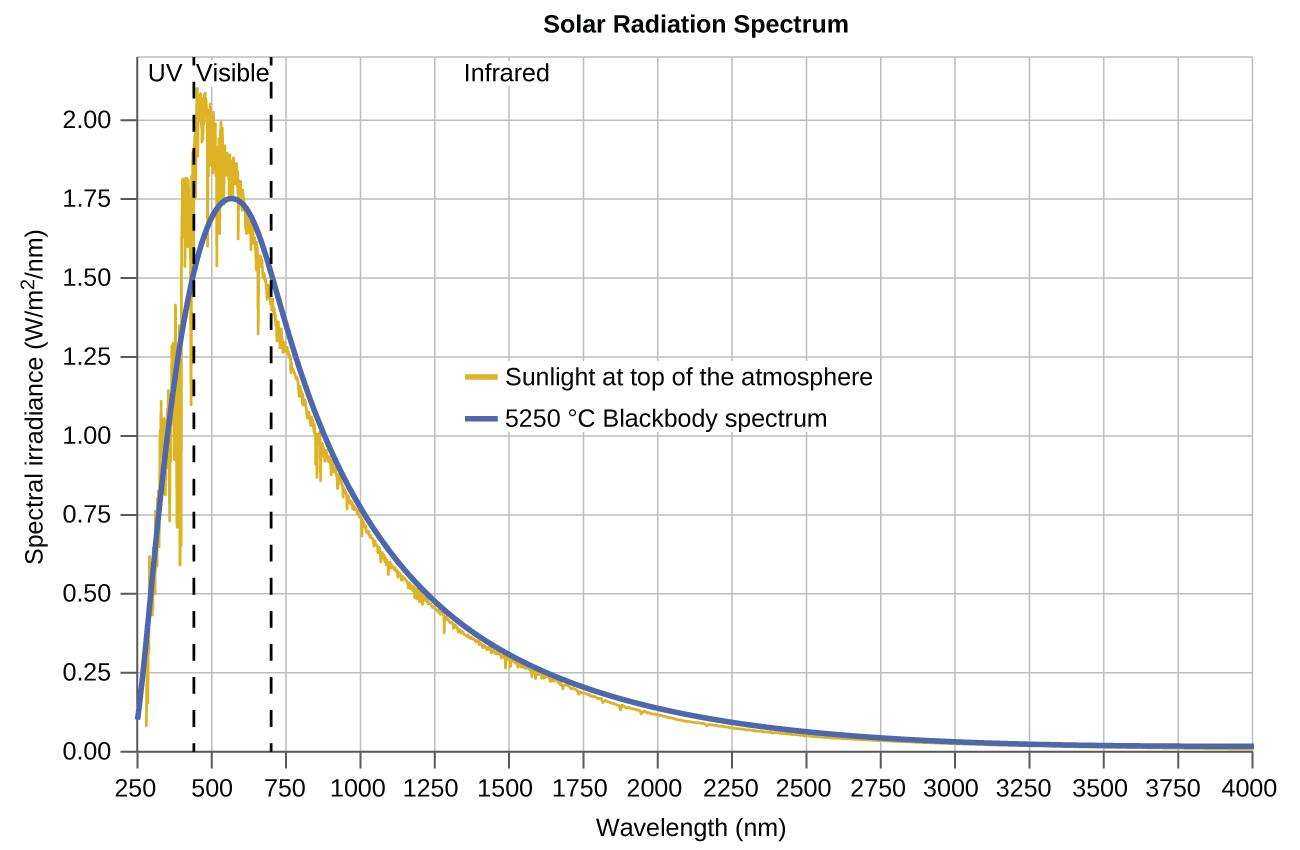
The last few decades of the nineteenth century witnessed intense research activity in commercializing newly discovered electric lighting. This required obtaining a better understanding of the distributions of light emitted from various sources being considered. Artificial lighting is usually designed to mimic natural sunlight within the limitations of the underlying technology. Such lighting consists of a range of broadly distributed frequencies that form a continuous spectrum    . [link] shows the wavelength distribution for sunlight. The most intense radiation is in the visible region, with the intensity dropping off rapidly for shorter wavelength ultraviolet (UV) light, and more slowly for longer wavelength infrared (IR) light.

A graph is shown with a horizontal axis labeled, “Wavelength ( n m ),” and a vertical axis labeled, “Spectral irradiance ( W divided by m superscript 2 divided by n m ).” The horizontal axis begins at 250 and extends to 4000 with markings provided every 250 n m. Similarly, the vertical axis begins at 0.00 and extends to 2.00 with markings every 0.25 units. Two vertical dashed lines are drawn. The first appears at about 400 nanometers and the second at nearly 700 nanometers. To the left of the first of these lines, the label, “U V,” appears at the top of the graph. Between these lines, the label, “Visible,” appears at the top of the graph. To the right of the second of these lines, the label, “Infrared,” appears at the top of the graph. A grey curve begins on the vertical axis at about 0.10. This curve increases steeply to a maximum value between the two vertical line segments of approximately 1.75 at about 625 nanometers. This curve decreases rapidly at first, then tapers off to reach a value of about 0 at the far right end of the graph. A golden colored curve traces along the same path as the grey curve, but shows a significant degree of variation in the region of the peak of the graph. In this general region, the gold curve is jagged and somewhat erratic. This curve reaches a maximum over 2.00 at around 475 nanometers. A key provided in the open space of the graph shows that the gold graph represents sunlight at the top of the atmosphere, and the grey curve represents the 5250 degrees C Blackbody spectrum.
The spectral distribution (light intensity vs. wavelength) of sunlight reaches the Earth's atmosphere as UV light, visible light, and IR light. The unabsorbed sunlight at the top of the atmosphere has a distribution that approximately matches the theoretical distribution of a blackbody at 5250 °C, represented by the blue curve. (credit: modification of work by American Society for Testing and Materials (ASTM) Terrestrial Reference Spectra for Photovoltaic Performance Evaluation)

Questions & Answers

differentiate between demand and supply giving examples
Lambiv Reply
differentiated between demand and supply using examples
Lambiv
what is labour ?
Lambiv
how will I do?
Venny Reply
how is the graph works?I don't fully understand
Rezat Reply
information
Eliyee
devaluation
Eliyee
t
WARKISA
hi guys good evening to all
Lambiv
multiple choice question
Aster Reply
appreciation
Eliyee
explain perfect market
Lindiwe Reply
In economics, a perfect market refers to a theoretical construct where all participants have perfect information, goods are homogenous, there are no barriers to entry or exit, and prices are determined solely by supply and demand. It's an idealized model used for analysis,
Ezea
What is ceteris paribus?
Shukri Reply
other things being equal
AI-Robot
When MP₁ becomes negative, TP start to decline. Extuples Suppose that the short-run production function of certain cut-flower firm is given by: Q=4KL-0.6K2 - 0.112 • Where is quantity of cut flower produced, I is labour input and K is fixed capital input (K-5). Determine the average product of lab
Kelo
Extuples Suppose that the short-run production function of certain cut-flower firm is given by: Q=4KL-0.6K2 - 0.112 • Where is quantity of cut flower produced, I is labour input and K is fixed capital input (K-5). Determine the average product of labour (APL) and marginal product of labour (MPL)
Kelo
yes,thank you
Shukri
Can I ask you other question?
Shukri
what is monopoly mean?
Habtamu Reply
What is different between quantity demand and demand?
Shukri Reply
Quantity demanded refers to the specific amount of a good or service that consumers are willing and able to purchase at a give price and within a specific time period. Demand, on the other hand, is a broader concept that encompasses the entire relationship between price and quantity demanded
Ezea
ok
Shukri
how do you save a country economic situation when it's falling apart
Lilia Reply
what is the difference between economic growth and development
Fiker Reply
Economic growth as an increase in the production and consumption of goods and services within an economy.but Economic development as a broader concept that encompasses not only economic growth but also social & human well being.
Shukri
production function means
Jabir
What do you think is more important to focus on when considering inequality ?
Abdisa Reply
any question about economics?
Awais Reply
sir...I just want to ask one question... Define the term contract curve? if you are free please help me to find this answer 🙏
Asui
it is a curve that we get after connecting the pareto optimal combinations of two consumers after their mutually beneficial trade offs
Awais
thank you so much 👍 sir
Asui
In economics, the contract curve refers to the set of points in an Edgeworth box diagram where both parties involved in a trade cannot be made better off without making one of them worse off. It represents the Pareto efficient allocations of goods between two individuals or entities, where neither p
Cornelius
In economics, the contract curve refers to the set of points in an Edgeworth box diagram where both parties involved in a trade cannot be made better off without making one of them worse off. It represents the Pareto efficient allocations of goods between two individuals or entities,
Cornelius
Suppose a consumer consuming two commodities X and Y has The following utility function u=X0.4 Y0.6. If the price of the X and Y are 2 and 3 respectively and income Constraint is birr 50. A,Calculate quantities of x and y which maximize utility. B,Calculate value of Lagrange multiplier. C,Calculate quantities of X and Y consumed with a given price. D,alculate optimum level of output .
Feyisa Reply
Answer
Feyisa
c
Jabir
the market for lemon has 10 potential consumers, each having an individual demand curve p=101-10Qi, where p is price in dollar's per cup and Qi is the number of cups demanded per week by the i th consumer.Find the market demand curve using algebra. Draw an individual demand curve and the market dema
Gsbwnw Reply
suppose the production function is given by ( L, K)=L¼K¾.assuming capital is fixed find APL and MPL. consider the following short run production function:Q=6L²-0.4L³ a) find the value of L that maximizes output b)find the value of L that maximizes marginal product
Abdureman
types of unemployment
Yomi Reply
What is the difference between perfect competition and monopolistic competition?
Mohammed
Got questions? Join the online conversation and get instant answers!
Jobilize.com Reply

Get Jobilize Job Search Mobile App in your pocket Now!

Get it on Google Play Download on the App Store Now


Source:  OpenStax, Chemistry. OpenStax CNX. May 20, 2015 Download for free at http://legacy.cnx.org/content/col11760/1.9
Google Play and the Google Play logo are trademarks of Google Inc.

Notification Switch

Would you like to follow the 'Chemistry' conversation and receive update notifications?

Ask