<< Chapter < Page Chapter >> Page >
This figure shows three rows of structures. In the first row, an O atom on the left is connected to a C atom on its right with a double bond indicated by a pair of short parallel line segments. To the right of the C atom are three dots in a horizontal row followed by an O atom double bonded to another O atom on its right. In the second row, an O atom is followed by three dots in a horizontal row, which are followed by a C atom and a second grouping of three dots. To the right is an O atom double bonded to another O atom. In the third row, an O atom on the left is connected to a C atom on its right with a double bond indicated by a pair of short parallel line segments. To the right of the C atom are three dots in a horizontal row followed by an O atom followed by another grouping of three dots to another O atom on its right.
Possible transition states (activated complexes) for carbon monoxide reacting with oxygen to form carbon dioxide. Solid lines represent covalent bonds, while dotted lines represent unstable orbital overlaps that may, or may not, become covalent bonds as product is formed. In the first two examples in this figure, the O=O double bond is not impacted; therefore, carbon dioxide cannot form. The third proposed transition state will result in the formation of carbon dioxide if the third “extra” oxygen atom separates from the rest of the molecule.

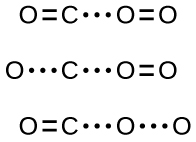
In most circumstances, it is impossible to isolate or identify a transition state or activated complex. In the reaction between carbon monoxide and oxygen to form carbon dioxide, activated complexes have only been observed spectroscopically in systems that utilize a heterogeneous catalyst. The gas-phase reaction occurs too rapidly to isolate any such chemical compound.

Collision theory explains why most reaction rates increase as concentrations increase. With an increase in the concentration of any reacting substance, the chances for collisions between molecules are increased because there are more molecules per unit of volume. More collisions mean a faster reaction rate, assuming the energy of the collisions is adequate.

Activation energy and the arrhenius equation

The minimum energy necessary to form a product during a collision between reactants is called the activation energy ( E a )    . The kinetic energy of reactant molecules plays an important role in a reaction because the energy necessary to form a product is provided by a collision of a reactant molecule with another reactant molecule. (In single-reactant reactions, activation energy may be provided by a collision of the reactant molecule with the wall of the reaction vessel or with molecules of an inert contaminant.) If the activation energy is much larger than the average kinetic energy of the molecules, the reaction will occur slowly: Only a few fast-moving molecules will have enough energy to react. If the activation energy is much smaller than the average kinetic energy of the molecules, the fraction of molecules possessing the necessary kinetic energy will be large; most collisions between molecules will result in reaction, and the reaction will occur rapidly.

[link] shows the energy relationships for the general reaction of a molecule of A with a molecule of B to form molecules of C and D :

A + B C + D

The figure shows that the energy of the transition state is higher than that of the reactants A and B by an amount equal to E a , the activation energy. Thus, the sum of the kinetic energies of A and B must be equal to or greater than E a to reach the transition state. After the transition state has been reached, and as C and D begin to form, the system loses energy until its total energy is lower than that of the initial mixture. This lost energy is transferred to other molecules, giving them enough energy to reach the transition state. The forward reaction (that between molecules A and B ) therefore tends to take place readily once the reaction has started. In [link] , Δ H represents the difference in enthalpy between the reactants ( A and B ) and the products ( C and D ). The sum of E a and Δ H represents the activation energy for the reverse reaction:

Questions & Answers

differentiate between demand and supply giving examples
Lambiv Reply
differentiated between demand and supply using examples
Lambiv
what is labour ?
Lambiv
how will I do?
Venny Reply
how is the graph works?I don't fully understand
Rezat Reply
information
Eliyee
devaluation
Eliyee
t
WARKISA
hi guys good evening to all
Lambiv
multiple choice question
Aster Reply
appreciation
Eliyee
explain perfect market
Lindiwe Reply
In economics, a perfect market refers to a theoretical construct where all participants have perfect information, goods are homogenous, there are no barriers to entry or exit, and prices are determined solely by supply and demand. It's an idealized model used for analysis,
Ezea
What is ceteris paribus?
Shukri Reply
other things being equal
AI-Robot
When MP₁ becomes negative, TP start to decline. Extuples Suppose that the short-run production function of certain cut-flower firm is given by: Q=4KL-0.6K2 - 0.112 • Where is quantity of cut flower produced, I is labour input and K is fixed capital input (K-5). Determine the average product of lab
Kelo
Extuples Suppose that the short-run production function of certain cut-flower firm is given by: Q=4KL-0.6K2 - 0.112 • Where is quantity of cut flower produced, I is labour input and K is fixed capital input (K-5). Determine the average product of labour (APL) and marginal product of labour (MPL)
Kelo
yes,thank you
Shukri
Can I ask you other question?
Shukri
what is monopoly mean?
Habtamu Reply
What is different between quantity demand and demand?
Shukri Reply
Quantity demanded refers to the specific amount of a good or service that consumers are willing and able to purchase at a give price and within a specific time period. Demand, on the other hand, is a broader concept that encompasses the entire relationship between price and quantity demanded
Ezea
ok
Shukri
how do you save a country economic situation when it's falling apart
Lilia Reply
what is the difference between economic growth and development
Fiker Reply
Economic growth as an increase in the production and consumption of goods and services within an economy.but Economic development as a broader concept that encompasses not only economic growth but also social & human well being.
Shukri
production function means
Jabir
What do you think is more important to focus on when considering inequality ?
Abdisa Reply
any question about economics?
Awais Reply
sir...I just want to ask one question... Define the term contract curve? if you are free please help me to find this answer 🙏
Asui
it is a curve that we get after connecting the pareto optimal combinations of two consumers after their mutually beneficial trade offs
Awais
thank you so much 👍 sir
Asui
In economics, the contract curve refers to the set of points in an Edgeworth box diagram where both parties involved in a trade cannot be made better off without making one of them worse off. It represents the Pareto efficient allocations of goods between two individuals or entities, where neither p
Cornelius
In economics, the contract curve refers to the set of points in an Edgeworth box diagram where both parties involved in a trade cannot be made better off without making one of them worse off. It represents the Pareto efficient allocations of goods between two individuals or entities,
Cornelius
Suppose a consumer consuming two commodities X and Y has The following utility function u=X0.4 Y0.6. If the price of the X and Y are 2 and 3 respectively and income Constraint is birr 50. A,Calculate quantities of x and y which maximize utility. B,Calculate value of Lagrange multiplier. C,Calculate quantities of X and Y consumed with a given price. D,alculate optimum level of output .
Feyisa Reply
Answer
Feyisa
c
Jabir
the market for lemon has 10 potential consumers, each having an individual demand curve p=101-10Qi, where p is price in dollar's per cup and Qi is the number of cups demanded per week by the i th consumer.Find the market demand curve using algebra. Draw an individual demand curve and the market dema
Gsbwnw Reply
suppose the production function is given by ( L, K)=L¼K¾.assuming capital is fixed find APL and MPL. consider the following short run production function:Q=6L²-0.4L³ a) find the value of L that maximizes output b)find the value of L that maximizes marginal product
Abdureman
types of unemployment
Yomi Reply
What is the difference between perfect competition and monopolistic competition?
Mohammed
Got questions? Join the online conversation and get instant answers!
Jobilize.com Reply
Practice Key Terms 5

Get Jobilize Job Search Mobile App in your pocket Now!

Get it on Google Play Download on the App Store Now


Source:  OpenStax, Chemistry. OpenStax CNX. May 20, 2015 Download for free at http://legacy.cnx.org/content/col11760/1.9
Google Play and the Google Play logo are trademarks of Google Inc.

Notification Switch

Would you like to follow the 'Chemistry' conversation and receive update notifications?

Ask