<< Chapter < Page Chapter >> Page >
By the end of this section, you will be able to:
  • Predict the structures of small molecules using valence shell electron pair repulsion (VSEPR) theory
  • Explain the concepts of polar covalent bonds and molecular polarity
  • Assess the polarity of a molecule based on its bonding and structure

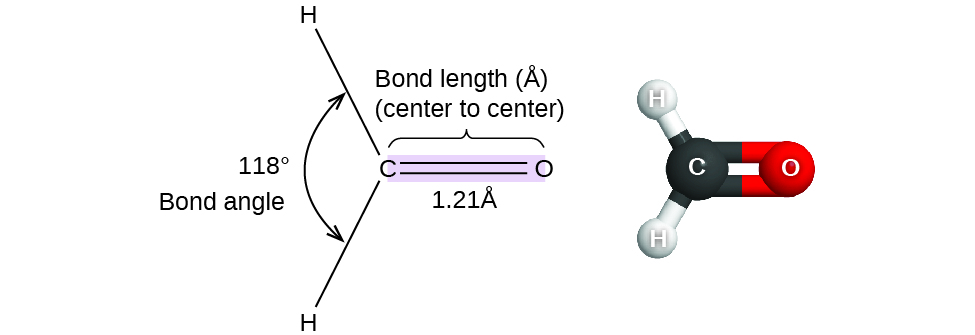
Thus far, we have used two-dimensional Lewis structures to represent molecules. However, molecular structure is actually three-dimensional, and it is important to be able to describe molecular bonds in terms of their distances, angles, and relative arrangements in space ( [link] ). A bond angle    is the angle between any two bonds that include a common atom, usually measured in degrees. A bond distance    (or bond length) is the distance between the nuclei of two bonded atoms along the straight line joining the nuclei. Bond distances are measured in Ångstroms (1 Å = 10 –10 m) or picometers (1 pm = 10 –12 m, 100 pm = 1 Å).

A pair of images are shown. The left image shows a carbon atom with three atoms bonded in a triangular arrangement around it. There are two hydrogen atoms bonded on the left side of the carbon and the angle between them is labeled, “118 degrees” and, “Bond angle.” The carbon is also double bonded to an oxygen atom. The double bond is shaded and there is a bracket which labels the bond, “Bond length ( angstrom ), ( center to center ),” and, “1.21 angstrom.” The right image shows a ball-and-stick model of the same elements. The hydrogen atoms are white, the carbon atom is black, and the oxygen atom is red.
Bond distances (lengths) and angles are shown for the formaldehyde molecule, H 2 CO.

Vsepr theory

Valence shell electron-pair repulsion theory (VSEPR theory) enables us to predict the molecular structure, including approximate bond angles around a central atom, of a molecule from an examination of the number of bonds and lone electron pairs in its Lewis structure. The VSEPR model assumes that electron pairs in the valence shell of a central atom will adopt an arrangement that minimizes repulsions between these electron pairs by maximizing the distance between them. The electrons in the valence shell of a central atom form either bonding pairs of electrons, located primarily between bonded atoms, or lone pairs. The electrostatic repulsion of these electrons is reduced when the various regions of high electron density assume positions as far from each other as possible.

VSEPR theory predicts the arrangement of electron pairs around each central atom and, usually, the correct arrangement of atoms in a molecule. We should understand, however, that the theory only considers electron-pair repulsions. Other interactions, such as nuclear-nuclear repulsions and nuclear-electron attractions, are also involved in the final arrangement that atoms adopt in a particular molecular structure.

As a simple example of VSEPR theory, let us predict the structure of a gaseous BeF 2 molecule. The Lewis structure of BeF 2 ( [link] ) shows only two electron pairs around the central beryllium atom. With two bonds and no lone pairs of electrons on the central atom, the bonds are as far apart as possible, and the electrostatic repulsion between these regions of high electron density is reduced to a minimum when they are on opposite sides of the central atom. The bond angle is 180° ( [link] ).

A Lewis structure is shown. A fluorine atom with three lone pairs of electrons is single bonded to a beryllium atom which is single bonded to a fluorine atom with three lone pairs of electrons. The angle of the bonds between the two fluorine atoms and the beryllium atom is labeled, “180 degrees.”
The BeF 2 molecule adopts a linear structure in which the two bonds are as far apart as possible, on opposite sides of the Be atom.

[link] illustrates this and other electron-pair geometries that minimize the repulsions among regions of high electron density (bonds and/or lone pairs). Two regions of electron density around a central atom in a molecule form a linear    geometry; three regions form a trigonal planar    geometry; four regions form a tetrahedral    geometry; five regions form a trigonal bipyramidal    geometry; and six regions form an octahedral    geometry.

Questions & Answers

Ayele, K., 2003. Introductory Economics, 3rd ed., Addis Ababa.
Widad Reply
can you send the book attached ?
Ariel
?
Ariel
What is economics
Widad Reply
the study of how humans make choices under conditions of scarcity
AI-Robot
U(x,y) = (x×y)1/2 find mu of x for y
Desalegn Reply
U(x,y) = (x×y)1/2 find mu of x for y
Desalegn
what is ecnomics
Jan Reply
this is the study of how the society manages it's scarce resources
Belonwu
what is macroeconomic
John Reply
macroeconomic is the branch of economics which studies actions, scale, activities and behaviour of the aggregate economy as a whole.
husaini
etc
husaini
difference between firm and industry
husaini Reply
what's the difference between a firm and an industry
Abdul
firm is the unit which transform inputs to output where as industry contain combination of firms with similar production 😅😅
Abdulraufu
Suppose the demand function that a firm faces shifted from Qd  120 3P to Qd  90  3P and the supply function has shifted from QS  20  2P to QS 10  2P . a) Find the effect of this change on price and quantity. b) Which of the changes in demand and supply is higher?
Toofiq Reply
explain standard reason why economic is a science
innocent Reply
factors influencing supply
Petrus Reply
what is economic.
Milan Reply
scares means__________________ends resources. unlimited
Jan
economics is a science that studies human behaviour as a relationship b/w ends and scares means which have alternative uses
Jan
calculate the profit maximizing for demand and supply
Zarshad Reply
Why qualify 28 supplies
Milan
what are explicit costs
Nomsa Reply
out-of-pocket costs for a firm, for example, payments for wages and salaries, rent, or materials
AI-Robot
concepts of supply in microeconomics
David Reply
economic overview notes
Amahle Reply
identify a demand and a supply curve
Salome Reply
i don't know
Parul
there's a difference
Aryan
Demand curve shows that how supply and others conditions affect on demand of a particular thing and what percent demand increase whith increase of supply of goods
Israr
Hi Sir please how do u calculate Cross elastic demand and income elastic demand?
Abari
Got questions? Join the online conversation and get instant answers!
Jobilize.com Reply

Get Jobilize Job Search Mobile App in your pocket Now!

Get it on Google Play Download on the App Store Now


Source:  OpenStax, Chemistry. OpenStax CNX. May 20, 2015 Download for free at http://legacy.cnx.org/content/col11760/1.9
Google Play and the Google Play logo are trademarks of Google Inc.

Notification Switch

Would you like to follow the 'Chemistry' conversation and receive update notifications?

Ask