<< Chapter < Page Chapter >> Page >

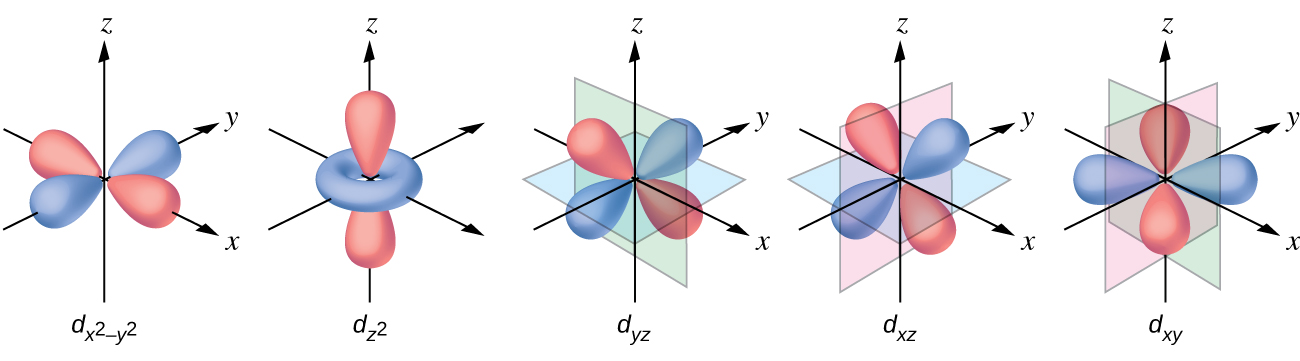
The other common geometry is square planar. It is possible to consider a square planar geometry as an octahedral structure with a pair of trans ligands removed. The removed ligands are assumed to be on the z -axis. This changes the distribution of the d orbitals, as orbitals on or near the z -axis become more stable, and those on or near the x- or y -axes become less stable. This results in the octahedral t 2 g and the e g sets splitting and gives a more complicated pattern with no simple Δ oct . The basic pattern is:

A diagram is shown with four rows of vertically oriented rectangles. The lower level has two rectangles with a space between them. The rectangle on the left is labeled, “d subscript x z,” below. The rectangle to its right is similarly labeled, “d subscript y z.” Just above, the second row contains only 1 rectangle above and between the lower two. This rectangle is labeled, “d subscript z squared.” Just above, the third row contains only 1 rectangle directly above. This rectangle is labeled, “d subscript x z.” Just above, the fourth row contains only 1 rectangle directly above. This rectangle is labeled, “d subscript x squared minus y squared.”

Magnetic moments of molecules and ions

Experimental evidence of magnetic measurements supports the theory of high- and low-spin complexes. Remember that molecules such as O 2 that contain unpaired electrons are paramagnetic. Paramagnetic substances are attracted to magnetic fields. Many transition metal complexes have unpaired electrons and hence are paramagnetic. Molecules such as N 2 and ions such as Na + and [Fe(CN) 6 ] 4− that contain no unpaired electrons are diamagnetic. Diamagnetic substances have a slight tendency to be repelled by magnetic fields.

When an electron in an atom or ion is unpaired, the magnetic moment due to its spin makes the entire atom or ion paramagnetic. The size of the magnetic moment of a system containing unpaired electrons is related directly to the number of such electrons: the greater the number of unpaired electrons, the larger the magnetic moment. Therefore, the observed magnetic moment is used to determine the number of unpaired electrons present. The measured magnetic moment of low-spin d 6 [Fe(CN) 6 ] 4− confirms that iron is diamagnetic, whereas high-spin d 6 [Fe(H 2 O) 6 ] 2+ has four unpaired electrons with a magnetic moment that confirms this arrangement.

Colors of transition metal complexes

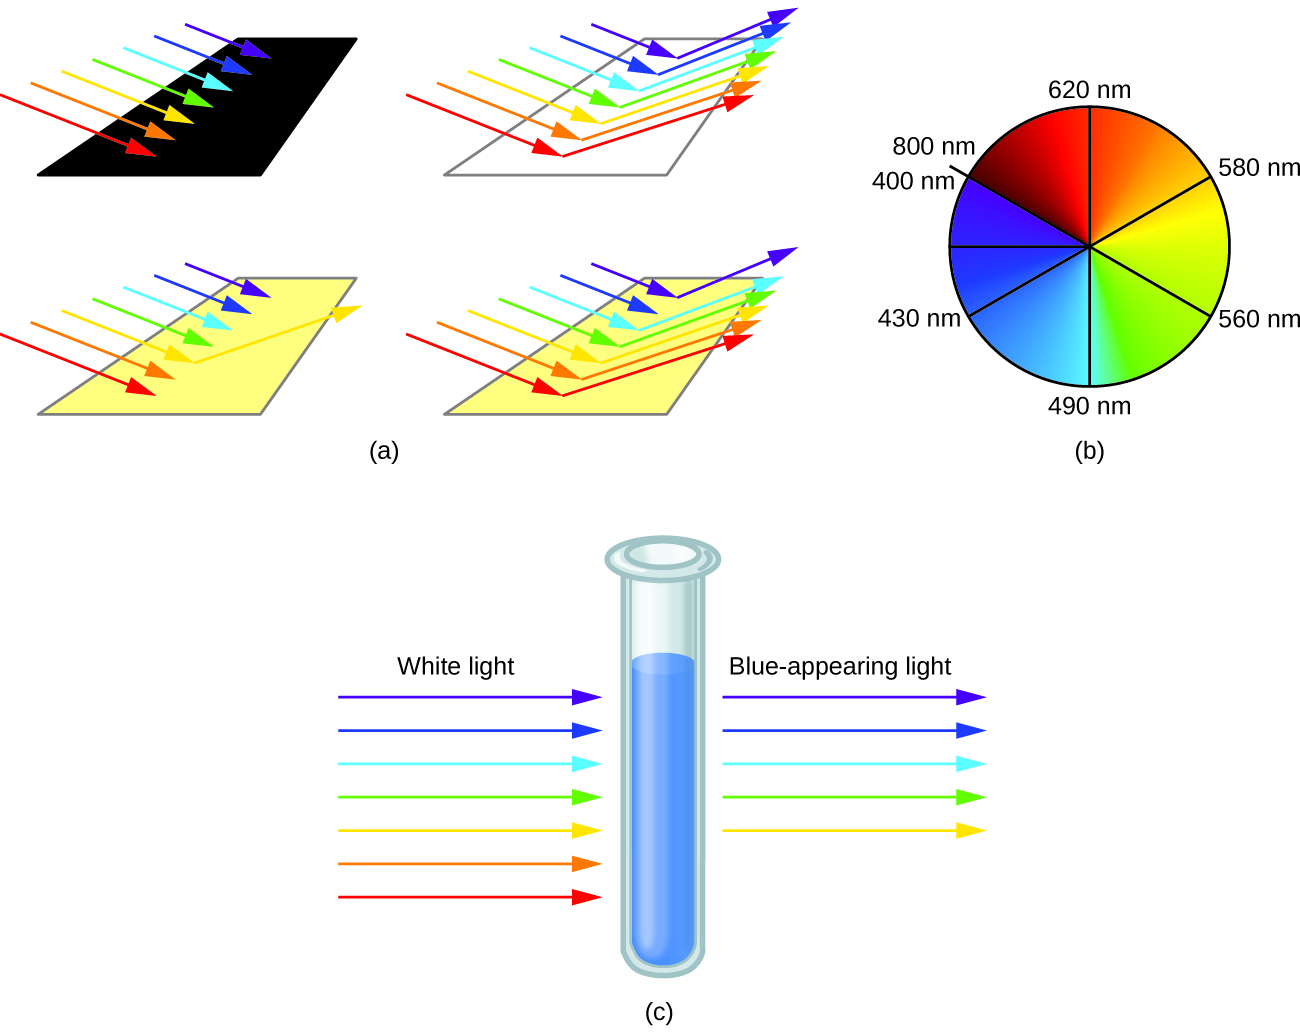
When atoms or molecules absorb light at the proper frequency, their electrons are excited to higher-energy orbitals. For many main group atoms and molecules, the absorbed photons are in the ultraviolet range of the electromagnetic spectrum, which cannot be detected by the human eye. For coordination compounds, the energy difference between the d orbitals often allows photons in the visible range to be absorbed.

The human eye perceives a mixture of all the colors, in the proportions present in sunlight, as white light. Complementary colors, those located across from each other on a color wheel, are also used in color vision. The eye perceives a mixture of two complementary colors, in the proper proportions, as white light. Likewise, when a color is missing from white light, the eye sees its complement. For example, when red photons are absorbed from white light, the eyes see the color green. When violet photons are removed from white light, the eyes see lemon yellow. The blue color of the [Cu(NH 3 ) 4 ] 2+ ion results because this ion absorbs orange and red light, leaving the complementary colors of blue and green ( [link] ).

This figure includes three diagrams. In a, red, orange, yellow, green, blue, indigo, and violet incident arrows point from the upper left to the lower right toward one black, one white, and two yellow rectangular surfaces. No arrows are indicated leaving the black surface. On the white surface, arrows of all included colors extend from the surface of the rectangle extending from just right of the tips of the incident arrows that approach the rectangle to the upper right. For the first yellow surface, only a yellow arrow extends from a point just past the tip of the yellow incident arrow to the upper right. For the second yellow surface, all colors of arrows except indigo extend from points just past the tips of the incident arrows to the upper right. In b, a circle shaded in red at the upper left blends to orange, yellow, green, blue, indigo, and violet moving clockwise about the circle. The leftmost side of the red region has a radius that is labeled, “800 n m,” at the edge of the circle. A radius drawn to the top of the circle in the red-orange region is labeled, “620 n m.” A radius drawn to a point near the center of the first quadrant of the circle in the orange-yellow region is labeled, “580 n m.” A radius drawn to a point near the center of the second quadrant of the circle in the yellow-green region is labeled, “560 n m.” A radius drawn to the bottom of the circle in the blue region is labeled, “490 n m.” A radius drawn to a point near the center of the third quadrant of the circle in the indigo region is labeled, “430 n m.” An unlabeled radius is drawn to the leftmost point on the circle in the violet region. The violet region ends where the red region began on the circle. This radius is labeled, “400 n m,” just to the left and below the, “800 n m,” label associated with the red region. In c, a test tube containing a blue substance is shown. To the left of the test tube, incident colored arrows are shown pointing to the test tube. The colors of the arrows in order from bottom to top are red, orange, yellow, green, blue, indigo, and violet. Above these arrows is the label, “White light.” To the right of the test tube, yellow, green, blue, indigo, and violet arrows point right. These arrows are positioned at the same level on the test tube as their matching incident arrows on the left of the test tube. Above these arrows is the label, “Blue-appearing light.”
(a) An object is black if it absorbs all colors of light. If it reflects all colors of light, it is white. An object has a color if it absorbs all colors except one, such as this yellow strip. The strip also appears yellow if it absorbs the complementary color from white light (in this case, indigo). (b) Complementary colors are located directly across from one another on the color wheel. (c) A solution of [Cu(NH 3 ) 4 ] 2+ ions absorbs red and orange light, so the transmitted light appears as the complementary color, blue.

Questions & Answers

differentiate between demand and supply giving examples
Lambiv Reply
differentiated between demand and supply using examples
Lambiv
what is labour ?
Lambiv
how will I do?
Venny Reply
how is the graph works?I don't fully understand
Rezat Reply
information
Eliyee
devaluation
Eliyee
t
WARKISA
hi guys good evening to all
Lambiv
multiple choice question
Aster Reply
appreciation
Eliyee
explain perfect market
Lindiwe Reply
In economics, a perfect market refers to a theoretical construct where all participants have perfect information, goods are homogenous, there are no barriers to entry or exit, and prices are determined solely by supply and demand. It's an idealized model used for analysis,
Ezea
What is ceteris paribus?
Shukri Reply
other things being equal
AI-Robot
When MP₁ becomes negative, TP start to decline. Extuples Suppose that the short-run production function of certain cut-flower firm is given by: Q=4KL-0.6K2 - 0.112 • Where is quantity of cut flower produced, I is labour input and K is fixed capital input (K-5). Determine the average product of lab
Kelo
Extuples Suppose that the short-run production function of certain cut-flower firm is given by: Q=4KL-0.6K2 - 0.112 • Where is quantity of cut flower produced, I is labour input and K is fixed capital input (K-5). Determine the average product of labour (APL) and marginal product of labour (MPL)
Kelo
yes,thank you
Shukri
Can I ask you other question?
Shukri
what is monopoly mean?
Habtamu Reply
What is different between quantity demand and demand?
Shukri Reply
Quantity demanded refers to the specific amount of a good or service that consumers are willing and able to purchase at a give price and within a specific time period. Demand, on the other hand, is a broader concept that encompasses the entire relationship between price and quantity demanded
Ezea
ok
Shukri
how do you save a country economic situation when it's falling apart
Lilia Reply
what is the difference between economic growth and development
Fiker Reply
Economic growth as an increase in the production and consumption of goods and services within an economy.but Economic development as a broader concept that encompasses not only economic growth but also social & human well being.
Shukri
production function means
Jabir
What do you think is more important to focus on when considering inequality ?
Abdisa Reply
any question about economics?
Awais Reply
sir...I just want to ask one question... Define the term contract curve? if you are free please help me to find this answer 🙏
Asui
it is a curve that we get after connecting the pareto optimal combinations of two consumers after their mutually beneficial trade offs
Awais
thank you so much 👍 sir
Asui
In economics, the contract curve refers to the set of points in an Edgeworth box diagram where both parties involved in a trade cannot be made better off without making one of them worse off. It represents the Pareto efficient allocations of goods between two individuals or entities, where neither p
Cornelius
In economics, the contract curve refers to the set of points in an Edgeworth box diagram where both parties involved in a trade cannot be made better off without making one of them worse off. It represents the Pareto efficient allocations of goods between two individuals or entities,
Cornelius
Suppose a consumer consuming two commodities X and Y has The following utility function u=X0.4 Y0.6. If the price of the X and Y are 2 and 3 respectively and income Constraint is birr 50. A,Calculate quantities of x and y which maximize utility. B,Calculate value of Lagrange multiplier. C,Calculate quantities of X and Y consumed with a given price. D,alculate optimum level of output .
Feyisa Reply
Answer
Feyisa
c
Jabir
the market for lemon has 10 potential consumers, each having an individual demand curve p=101-10Qi, where p is price in dollar's per cup and Qi is the number of cups demanded per week by the i th consumer.Find the market demand curve using algebra. Draw an individual demand curve and the market dema
Gsbwnw Reply
suppose the production function is given by ( L, K)=L¼K¾.assuming capital is fixed find APL and MPL. consider the following short run production function:Q=6L²-0.4L³ a) find the value of L that maximizes output b)find the value of L that maximizes marginal product
Abdureman
types of unemployment
Yomi Reply
What is the difference between perfect competition and monopolistic competition?
Mohammed
Got questions? Join the online conversation and get instant answers!
Jobilize.com Reply

Get Jobilize Job Search Mobile App in your pocket Now!

Get it on Google Play Download on the App Store Now


Source:  OpenStax, Chemistry. OpenStax CNX. May 20, 2015 Download for free at http://legacy.cnx.org/content/col11760/1.9
Google Play and the Google Play logo are trademarks of Google Inc.

Notification Switch

Would you like to follow the 'Chemistry' conversation and receive update notifications?

Ask