<< Chapter < Page Chapter >> Page >
By the end of this section, you will be able to:
  • Describe structure and properties of nonmetals

The nonmetals are elements located in the upper right portion of the periodic table. Their properties and behavior are quite different from those of metals on the left side. Under normal conditions, more than half of the nonmetals are gases, one is a liquid, and the rest include some of the softest and hardest of solids. The nonmetals exhibit a rich variety of chemical behaviors. They include the most reactive and least reactive of elements, and they form many different ionic and covalent compounds. This section presents an overview of the properties and chemical behaviors of the nonmetals, as well as the chemistry of specific elements. Many of these nonmetals are important in biological systems.

In many cases, trends in electronegativity enable us to predict the type of bonding and the physical states in compounds involving the nonmetals. We know that electronegativity decreases as we move down a given group and increases as we move from left to right across a period. The nonmetals have higher electronegativities than do metals, and compounds formed between metals and nonmetals are generally ionic in nature because of the large differences in electronegativity between them. The metals form cations, the nonmetals form anions, and the resulting compounds are solids under normal conditions. On the other hand, compounds formed between two or more nonmetals have small differences in electronegativity between the atoms, and covalent bonding—sharing of electrons—results. These substances tend to be molecular in nature and are gases, liquids, or volatile solids at room temperature and pressure.

In normal chemical processes, nonmetals do not form monatomic positive ions (cations) because their ionization energies are too high. All monatomic nonmetal ions are anions; examples include the chloride ion, Cl , the nitride ion, N 3− , and the selenide ion, Se 2− .

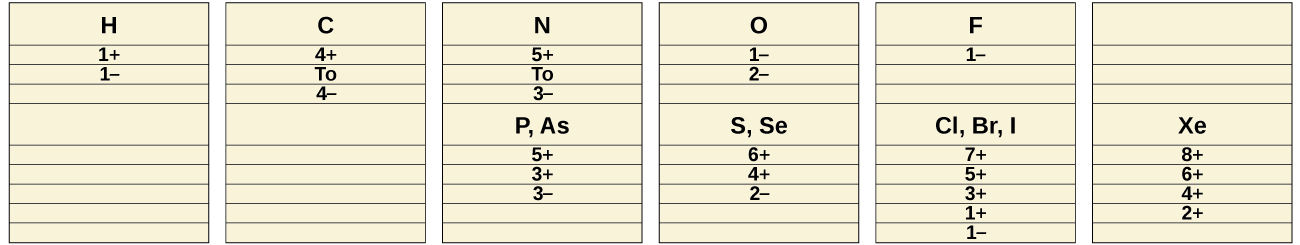
The common oxidation states that the nonmetals exhibit in their ionic and covalent compounds are shown in [link] . Remember that an element exhibits a positive oxidation state when combined with a more electronegative element and that it exhibits a negative oxidation state when combined with a less electronegative element.

Six columns of information are shown. The first column has three pieces of data: “H,” “1 positive sign,” and “1 negative sign.” The second column has four pieces of data: “C,” “4 positive sign,” the word, “To,” and, “4 negative sign.” The third column has eight pieces of data: “N,” “5 positive sign,” the word, “To,” “3 negative sign,” “P, A s,” “5 positive sign,” “3 positive sign,” and “3 negative sign.” The fourth column has seven pieces of data: “O,” “1 negative sign,” “2 negative sign,” “S, S e,” “6 positive sign,” “4 positive sign,” and “2 negative sign.” The fifth column has eight pieces of data: “F,” “1 negative sign,” “C l, B r, I,” “7 positive sign,” “5 positive sign,” “3 positive sign,” “1 positive sign,” and “1 negative sign.” The sixth column has five pieces of data: “X e,” “8 positive sign,” “6 positive sign,” “4 positive sign,” and “2 positive sign.”
Nonmetals exhibit these common oxidation states in ionic and covalent compounds.

The first member of each nonmetal group exhibits different behaviors, in many respects, from the other group members. The reasons for this include smaller size, greater ionization energy, and (most important) the fact that the first member of each group has only four valence orbitals (one 2 s and three 2 p ) available for bonding, whereas other group members have empty d orbitals in their valence shells, making possible five, six, or even more bonds around the central atom. For example, nitrogen forms only NF 3, whereas phosphorus forms both PF 3 and PF 5 .

Another difference between the first group member and subsequent members is the greater ability of the first member to form π bonds. This is primarily a function of the smaller size of the first member of each group, which allows better overlap of atomic orbitals. Nonmetals, other than the first member of each group, rarely form π bonds to nonmetals that are the first member of a group. For example, sulfur-oxygen π bonds are well known, whereas sulfur does not normally form stable π bonds to itself.

Questions & Answers

differentiate between demand and supply giving examples
Lambiv Reply
differentiated between demand and supply using examples
Lambiv
what is labour ?
Lambiv
how will I do?
Venny Reply
how is the graph works?I don't fully understand
Rezat Reply
information
Eliyee
devaluation
Eliyee
t
WARKISA
hi guys good evening to all
Lambiv
multiple choice question
Aster Reply
appreciation
Eliyee
explain perfect market
Lindiwe Reply
In economics, a perfect market refers to a theoretical construct where all participants have perfect information, goods are homogenous, there are no barriers to entry or exit, and prices are determined solely by supply and demand. It's an idealized model used for analysis,
Ezea
What is ceteris paribus?
Shukri Reply
other things being equal
AI-Robot
When MP₁ becomes negative, TP start to decline. Extuples Suppose that the short-run production function of certain cut-flower firm is given by: Q=4KL-0.6K2 - 0.112 • Where is quantity of cut flower produced, I is labour input and K is fixed capital input (K-5). Determine the average product of lab
Kelo
Extuples Suppose that the short-run production function of certain cut-flower firm is given by: Q=4KL-0.6K2 - 0.112 • Where is quantity of cut flower produced, I is labour input and K is fixed capital input (K-5). Determine the average product of labour (APL) and marginal product of labour (MPL)
Kelo
yes,thank you
Shukri
Can I ask you other question?
Shukri
what is monopoly mean?
Habtamu Reply
What is different between quantity demand and demand?
Shukri Reply
Quantity demanded refers to the specific amount of a good or service that consumers are willing and able to purchase at a give price and within a specific time period. Demand, on the other hand, is a broader concept that encompasses the entire relationship between price and quantity demanded
Ezea
ok
Shukri
how do you save a country economic situation when it's falling apart
Lilia Reply
what is the difference between economic growth and development
Fiker Reply
Economic growth as an increase in the production and consumption of goods and services within an economy.but Economic development as a broader concept that encompasses not only economic growth but also social & human well being.
Shukri
production function means
Jabir
What do you think is more important to focus on when considering inequality ?
Abdisa Reply
any question about economics?
Awais Reply
sir...I just want to ask one question... Define the term contract curve? if you are free please help me to find this answer 🙏
Asui
it is a curve that we get after connecting the pareto optimal combinations of two consumers after their mutually beneficial trade offs
Awais
thank you so much 👍 sir
Asui
In economics, the contract curve refers to the set of points in an Edgeworth box diagram where both parties involved in a trade cannot be made better off without making one of them worse off. It represents the Pareto efficient allocations of goods between two individuals or entities, where neither p
Cornelius
In economics, the contract curve refers to the set of points in an Edgeworth box diagram where both parties involved in a trade cannot be made better off without making one of them worse off. It represents the Pareto efficient allocations of goods between two individuals or entities,
Cornelius
Suppose a consumer consuming two commodities X and Y has The following utility function u=X0.4 Y0.6. If the price of the X and Y are 2 and 3 respectively and income Constraint is birr 50. A,Calculate quantities of x and y which maximize utility. B,Calculate value of Lagrange multiplier. C,Calculate quantities of X and Y consumed with a given price. D,alculate optimum level of output .
Feyisa Reply
Answer
Feyisa
c
Jabir
the market for lemon has 10 potential consumers, each having an individual demand curve p=101-10Qi, where p is price in dollar's per cup and Qi is the number of cups demanded per week by the i th consumer.Find the market demand curve using algebra. Draw an individual demand curve and the market dema
Gsbwnw Reply
suppose the production function is given by ( L, K)=L¼K¾.assuming capital is fixed find APL and MPL. consider the following short run production function:Q=6L²-0.4L³ a) find the value of L that maximizes output b)find the value of L that maximizes marginal product
Abdureman
types of unemployment
Yomi Reply
What is the difference between perfect competition and monopolistic competition?
Mohammed
Got questions? Join the online conversation and get instant answers!
Jobilize.com Reply
Practice Key Terms 2

Get Jobilize Job Search Mobile App in your pocket Now!

Get it on Google Play Download on the App Store Now


Source:  OpenStax, Chemistry. OpenStax CNX. May 20, 2015 Download for free at http://legacy.cnx.org/content/col11760/1.9
Google Play and the Google Play logo are trademarks of Google Inc.

Notification Switch

Would you like to follow the 'Chemistry' conversation and receive update notifications?

Ask