Explain the function of a catalyst in terms of reaction mechanisms and potential energy diagrams
List examples of catalysis in natural and industrial processes
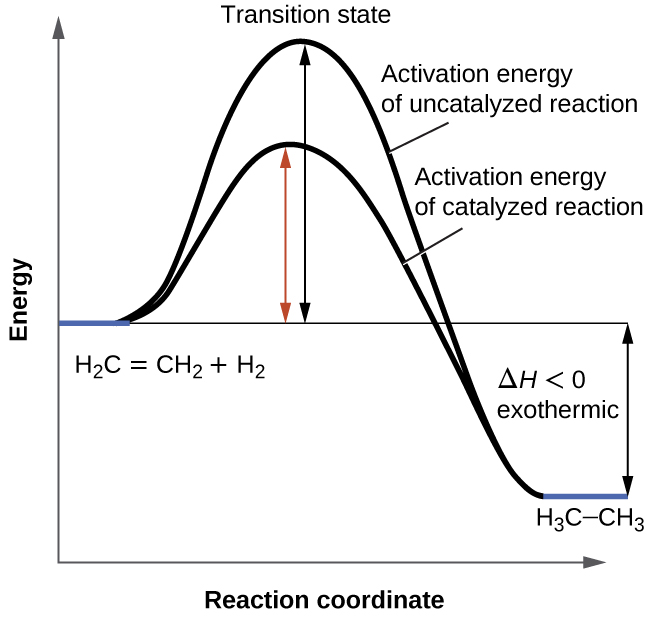
We have seen that the rate of many reactions can be accelerated by catalysts. A catalyst speeds up the rate of a reaction by lowering the activation energy; in addition, the catalyst is regenerated in the process. Several reactions that are thermodynamically favorable in the absence of a catalyst only occur at a reasonable rate when a catalyst is present. One such reaction is catalytic hydrogenation, the process by which hydrogen is added across an alkene C=C bond to afford the saturated alkane product. A comparison of the reaction coordinate diagrams (also known as energy diagrams) for catalyzed and uncatalyzed alkene hydrogenation is shown in
[link] .
This graph compares the reaction coordinates for catalyzed and uncatalyzed alkene hydrogenation.
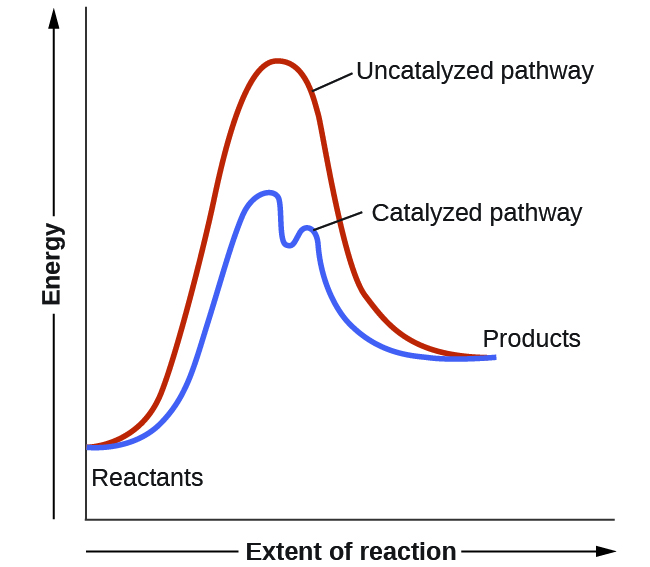
Catalysts function by providing an alternate reaction mechanism that has a lower activation energy than would be found in the absence of the catalyst. In some cases, the catalyzed mechanism may include additional steps, as depicted in the reaction diagrams shown in
[link] . This lower activation energy results in an increase in rate as described by the Arrhenius equation. Note that a catalyst decreases the activation energy for both the forward and the reverse reactions and hence
accelerates both the forward and the reverse reactions . Consequently, the presence of a catalyst will permit a system to reach equilibrium more quickly, but it has no effect on the position of the equilibrium as reflected in the value of its equilibrium constant (see the later chapter on chemical equilibrium).
This potential energy diagram shows the effect of a catalyst on the activation energy. The catalyst provides a different reaction path with a lower activation energy. As shown, the catalyzed pathway involves a two-step mechanism (note the presence of two transition states) and an intermediate species (represented by the valley between the two transitions states).
Using reaction diagrams to compare catalyzed reactions
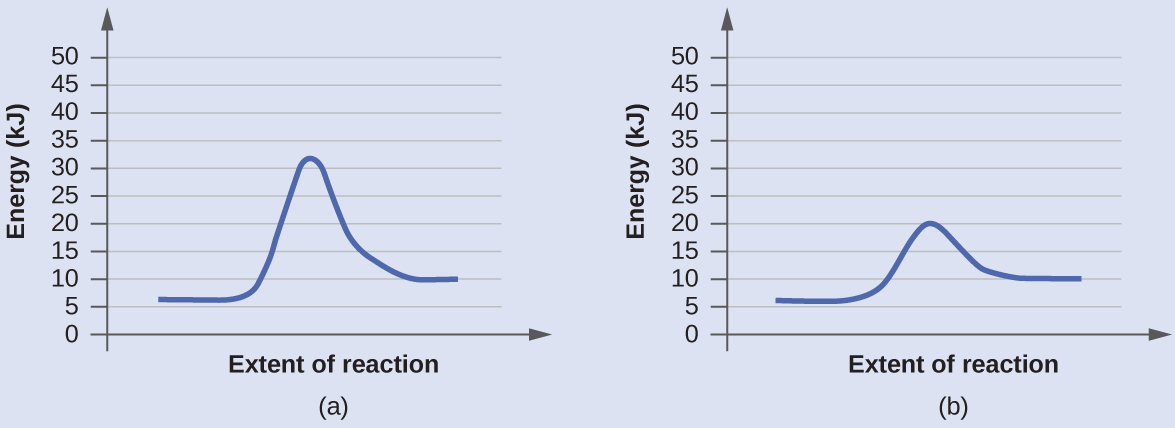
The two reaction diagrams here represent the same reaction: one without a catalyst and one with a catalyst. Identify which diagram suggests the presence of a catalyst, and determine the activation energy for the catalyzed reaction:
Solution
A catalyst does not affect the energy of reactant or product, so those aspects of the diagrams can be ignored; they are, as we would expect, identical in that respect. There is, however, a noticeable difference in the transition state, which is distinctly lower in diagram (b) than it is in (a). This indicates the use of a catalyst in diagram (b). The activation energy is the difference between the energy of the starting reagents and the transition state—a maximum on the reaction coordinate diagram. The reagents are at 6 kJ and the transition state is at 20 kJ, so the activation energy can be calculated as follows:
Check your learning
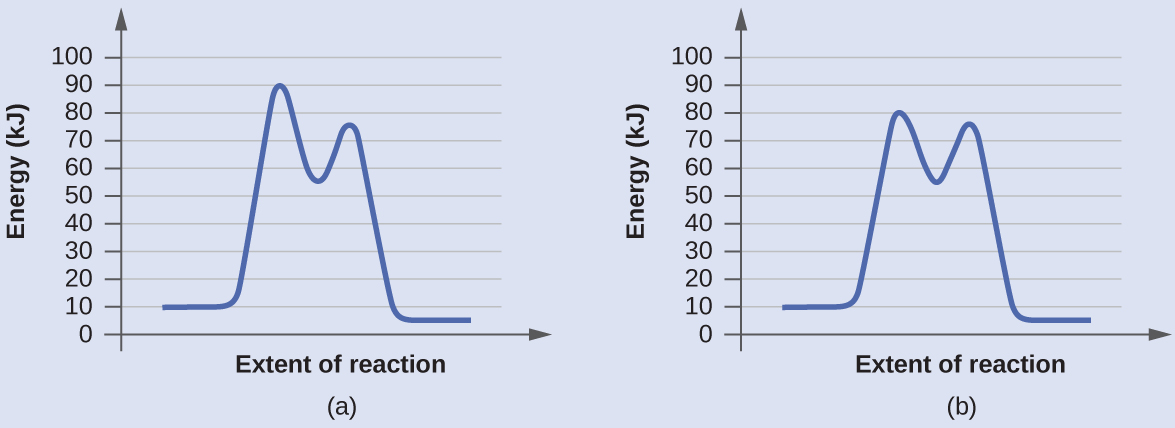
Determine which of the two diagrams here (both for the same reaction) involves a catalyst, and identify the activation energy for the catalyzed reaction:
Answer:
Diagram (b) is a catalyzed reaction with an activation energy of about 70 kJ.
In economics, a perfect market refers to a theoretical construct where all participants have perfect information, goods are homogenous, there are no barriers to entry or exit, and prices are determined solely by supply and demand. It's an idealized model used for analysis,
When MP₁ becomes negative, TP start to decline.
Extuples Suppose that the short-run production function of certain cut-flower firm is given by: Q=4KL-0.6K2 - 0.112 •
Where is quantity of cut flower produced, I is labour input and K is fixed capital input (K-5). Determine the average product of lab
Kelo
Extuples Suppose that the short-run production function of certain cut-flower firm is given by: Q=4KL-0.6K2 - 0.112 •
Where is quantity of cut flower produced, I is labour input and K is fixed capital input (K-5). Determine the average product of labour (APL) and marginal product of labour (MPL)
Quantity demanded refers to the specific amount of a good or service that consumers are willing and able to purchase at a give price and within a specific time period. Demand, on the other hand, is a broader concept that encompasses the entire relationship between price and quantity demanded
Ezea
ok
Shukri
how do you save a country economic situation when it's falling apart
Economic growth as an increase in the production and consumption of goods and services within an economy.but
Economic development as a broader concept that encompasses not only economic growth but also social & human well being.
Shukri
production function means
Jabir
What do you think is more important to focus on when considering inequality ?
sir...I just want to ask one question... Define the term contract curve? if you are free please help me to find this answer 🙏
Asui
it is a curve that we get after connecting the pareto optimal combinations of two consumers after their mutually beneficial trade offs
Awais
thank you so much 👍 sir
Asui
In economics, the contract curve refers to the set of points in an Edgeworth box diagram where both parties involved in a trade cannot be made better off without making one of them worse off. It represents the Pareto efficient allocations of goods between two individuals or entities, where neither p
Cornelius
In economics, the contract curve refers to the set of points in an Edgeworth box diagram where both parties involved in a trade cannot be made better off without making one of them worse off. It represents the Pareto efficient allocations of goods between two individuals or entities,
Cornelius
Suppose a consumer consuming two commodities X and Y has
The following utility function u=X0.4 Y0.6. If the price of the X and Y are 2 and 3 respectively and income Constraint is birr 50.
A,Calculate quantities of x and y which maximize utility.
B,Calculate value of Lagrange multiplier.
C,Calculate quantities of X and Y consumed with a given price.
D,alculate optimum level of output .