Explain the function of a catalyst in terms of reaction mechanisms and potential energy diagrams
List examples of catalysis in natural and industrial processes
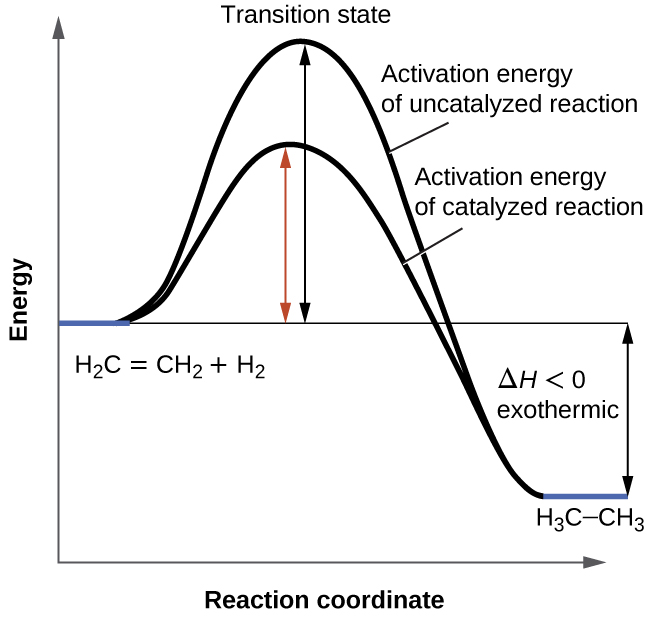
We have seen that the rate of many reactions can be accelerated by catalysts. A catalyst speeds up the rate of a reaction by lowering the activation energy; in addition, the catalyst is regenerated in the process. Several reactions that are thermodynamically favorable in the absence of a catalyst only occur at a reasonable rate when a catalyst is present. One such reaction is catalytic hydrogenation, the process by which hydrogen is added across an alkene C=C bond to afford the saturated alkane product. A comparison of the reaction coordinate diagrams (also known as energy diagrams) for catalyzed and uncatalyzed alkene hydrogenation is shown in
[link] .
This graph compares the reaction coordinates for catalyzed and uncatalyzed alkene hydrogenation.
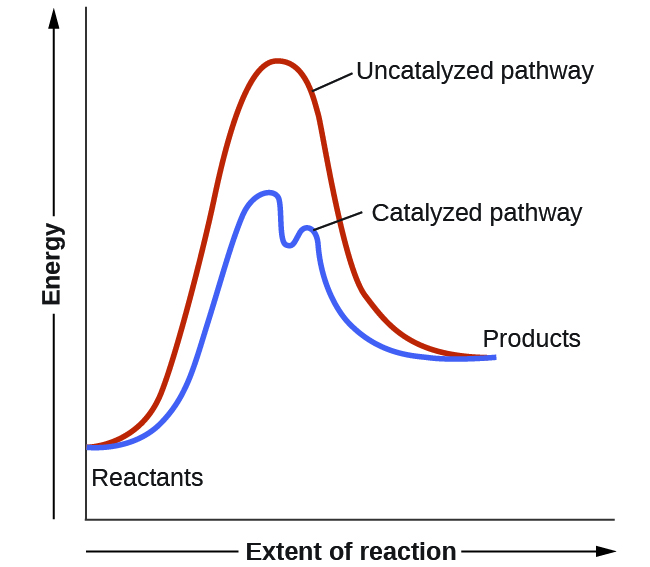
Catalysts function by providing an alternate reaction mechanism that has a lower activation energy than would be found in the absence of the catalyst. In some cases, the catalyzed mechanism may include additional steps, as depicted in the reaction diagrams shown in
[link] . This lower activation energy results in an increase in rate as described by the Arrhenius equation. Note that a catalyst decreases the activation energy for both the forward and the reverse reactions and hence
accelerates both the forward and the reverse reactions . Consequently, the presence of a catalyst will permit a system to reach equilibrium more quickly, but it has no effect on the position of the equilibrium as reflected in the value of its equilibrium constant (see the later chapter on chemical equilibrium).
This potential energy diagram shows the effect of a catalyst on the activation energy. The catalyst provides a different reaction path with a lower activation energy. As shown, the catalyzed pathway involves a two-step mechanism (note the presence of two transition states) and an intermediate species (represented by the valley between the two transitions states).
Using reaction diagrams to compare catalyzed reactions
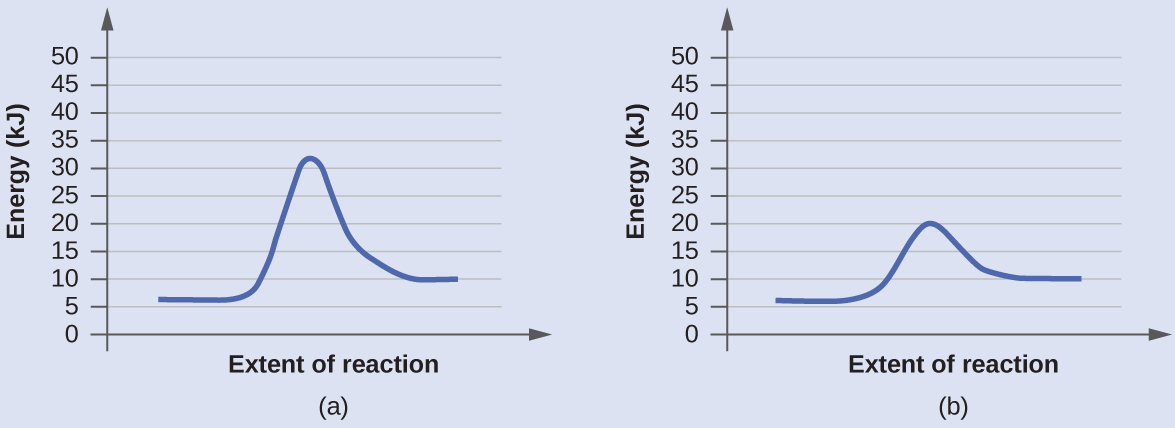
The two reaction diagrams here represent the same reaction: one without a catalyst and one with a catalyst. Identify which diagram suggests the presence of a catalyst, and determine the activation energy for the catalyzed reaction:
Solution
A catalyst does not affect the energy of reactant or product, so those aspects of the diagrams can be ignored; they are, as we would expect, identical in that respect. There is, however, a noticeable difference in the transition state, which is distinctly lower in diagram (b) than it is in (a). This indicates the use of a catalyst in diagram (b). The activation energy is the difference between the energy of the starting reagents and the transition state—a maximum on the reaction coordinate diagram. The reagents are at 6 kJ and the transition state is at 20 kJ, so the activation energy can be calculated as follows:
Check your learning
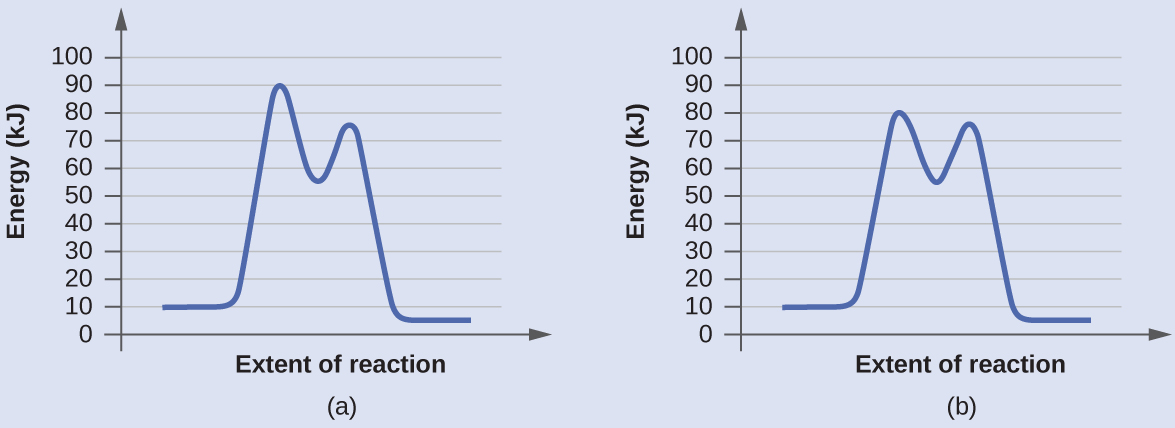
Determine which of the two diagrams here (both for the same reaction) involves a catalyst, and identify the activation energy for the catalyzed reaction:
Answer:
Diagram (b) is a catalyzed reaction with an activation energy of about 70 kJ.
Three charges q_{1}=+3\mu C, q_{2}=+6\mu C and q_{3}=+8\mu C are located at (2,0)m (0,0)m and (0,3) coordinates respectively. Find the magnitude and direction acted upon q_{2} by the two other charges.Draw the correct graphical illustration of the problem above showing the direction of all forces.
To solve this problem, we need to first find the net force acting on charge q_{2}. The magnitude of the force exerted by q_{1} on q_{2} is given by F=\frac{kq_{1}q_{2}}{r^{2}} where k is the Coulomb constant, q_{1} and q_{2} are the charges of the particles, and r is the distance between them.
Muhammed
What is the direction and net electric force on q_{1}= 5µC located at (0,4)r due to charges q_{2}=7mu located at (0,0)m and q_{3}=3\mu C located at (4,0)m?
Capacitor is a separation of opposite charges using an insulator of very small dimension between them. Capacitor is used for allowing an AC (alternating current) to pass while a DC (direct current) is blocked.
Gautam
A motor travelling at 72km/m on sighting a stop sign applying the breaks such that under constant deaccelerate in the meters of 50 metres what is the magnitude of the accelerate
velocity can be 72 km/h in question. 72 km/h=20 m/s, v^2=2.a.x , 20^2=2.a.50, a=4 m/s^2.
Mehmet
A boat travels due east at a speed of 40meter per seconds across a river flowing due south at 30meter per seconds. what is the resultant speed of the boat
which has a higher temperature, 1cup of boiling water or 1teapot of boiling water which can transfer more heat 1cup of boiling water or 1 teapot of boiling water explain your . answer
I believe temperature being an intensive property does not change for any amount of boiling water whereas heat being an extensive property changes with amount/size of the system.
Someone
Scratch that
Someone
temperature for any amount of water to boil at ntp is 100⁰C (it is a state function and and intensive property) and it depends both will give same amount of heat because the surface available for heat transfer is greater in case of the kettle as well as the heat stored in it but if you talk.....
Someone
about the amount of heat stored in the system then in that case since the mass of water in the kettle is greater so more energy is required to raise the temperature b/c more molecules of water are present in the kettle
pratica A on solution of hydro chloric acid,B is a solution containing 0.5000 mole ofsodium chlorid per dm³,put A in the burret and titrate 20.00 or 25.00cm³ portion of B using melting orange as the indicator. record the deside of your burret tabulate the burret reading and calculate the average volume of acid used?
No. According to Isac Newtons law. this two bodies maybe you and the wall beside you.
Attracting depends on the mass och each body and distance between them.
Dlovan
Are you really asking if two bodies have to be charged to be influenced by Coulombs Law?
Specific heat capacity is a measure of the amount of energy required to raise the temperature of a substance by one degree Celsius (or Kelvin). It is measured in Joules per kilogram per degree Celsius (J/kg°C).
AI-Robot
specific heat capacity is the amount of energy needed to raise the temperature of a substance by one degree Celsius or kelvin
ROKEEB
Got questions? Join the online conversation and get instant answers!