<< Chapter < Page Chapter >> Page >
By the end of this section, you will be able to:
  • Define phase transitions and phase transition temperatures
  • Explain the relation between phase transition temperatures and intermolecular attractive forces
  • Describe the processes represented by typical heating and cooling curves, and compute heat flows and enthalpy changes accompanying these processes

We witness and utilize changes of physical state, or phase transitions, in a great number of ways. As one example of global significance, consider the evaporation, condensation, freezing, and melting of water. These changes of state are essential aspects of our earth’s water cycle as well as many other natural phenomena and technological processes of central importance to our lives. In this module, the essential aspects of phase transitions are explored.

Vaporization and condensation

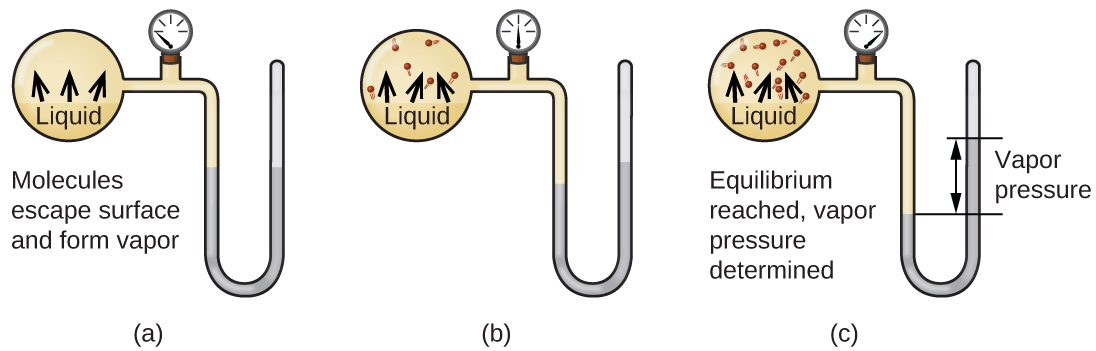
When a liquid vaporizes in a closed container, gas molecules cannot escape. As these gas phase molecules move randomly about, they will occasionally collide with the surface of the condensed phase, and in some cases, these collisions will result in the molecules re-entering the condensed phase. The change from the gas phase to the liquid is called condensation    . When the rate of condensation becomes equal to the rate of vaporization    , neither the amount of the liquid nor the amount of the vapor in the container changes. The vapor in the container is then said to be in equilibrium with the liquid. Keep in mind that this is not a static situation, as molecules are continually exchanged between the condensed and gaseous phases. Such is an example of a dynamic equilibrium    , the status of a system in which reciprocal processes (for example, vaporization and condensation) occur at equal rates. The pressure exerted by the vapor in equilibrium with a liquid in a closed container at a given temperature is called the liquid’s vapor pressure    (or equilibrium vapor pressure). The area of the surface of the liquid in contact with a vapor and the size of the vessel have no effect on the vapor pressure, although they do affect the time required for the equilibrium to be reached. We can measure the vapor pressure of a liquid by placing a sample in a closed container, like that illustrated in [link] , and using a manometer to measure the increase in pressure that is due to the vapor in equilibrium with the condensed phase.

Three images are shown and labeled “a,” “b,” and “c.” Each image shows a round bulb connected on the right to a tube that is horizontal, then is bent vertically, curves, and then is vertical again to make a u-shape. A valve is located in the horizontal portion of the tube. Image a depicts a liquid in the bulb, labeled, “Liquid,” and upward-facing arrows leading away from the surface of the liquid. The phrase, “Molecules escape surface and form vapor” is written below the bulb, and a gray liquid in the u-shaped portion of the tube is shown at equal heights on the right and left sides. Image b depicts a liquid in the bulb, labeled, “Liquid,” and upward-facing arrows leading away from the surface of the liquid to molecules drawn in the upper portion of the bulb. A gray liquid in the u-shaped portion of the tube is shown slightly higher on the right side than on the left side. Image c depicts a liquid in the bulb, labeled, “Liquid,” and upward-facing arrows leading away from the surface of the liquid to molecules drawn in the upper portion of the bulb. There are more molecules present in c than in b. The phrase “Equilibrium reached, vapor pressure determined,” is written below the bulb and a gray liquid in the u-shaped portion of the tube is shown higher on the right side. A horizontal line is drawn level with each of these liquid levels and the distance between the lines is labeled with a double-headed arrow. This section is labeled with the phrase, “Vapor pressure.”
In a closed container, dynamic equilibrium is reached when (a) the rate of molecules escaping from the liquid to become the gas (b) increases and eventually (c) equals the rate of gas molecules entering the liquid. When this equilibrium is reached, the vapor pressure of the gas is constant, although the vaporization and condensation processes continue.

The chemical identities of the molecules in a liquid determine the types (and strengths) of intermolecular attractions possible; consequently, different substances will exhibit different equilibrium vapor pressures. Relatively strong intermolecular attractive forces will serve to impede vaporization as well as favoring “recapture” of gas-phase molecules when they collide with the liquid surface, resulting in a relatively low vapor pressure. Weak intermolecular attractions present less of a barrier to vaporization, and a reduced likelihood of gas recapture, yielding relatively high vapor pressures. The following example illustrates this dependence of vapor pressure on intermolecular attractive forces.

Questions & Answers

differentiate between demand and supply giving examples
Lambiv Reply
differentiated between demand and supply using examples
Lambiv
what is labour ?
Lambiv
how will I do?
Venny Reply
how is the graph works?I don't fully understand
Rezat Reply
information
Eliyee
devaluation
Eliyee
t
WARKISA
hi guys good evening to all
Lambiv
multiple choice question
Aster Reply
appreciation
Eliyee
explain perfect market
Lindiwe Reply
In economics, a perfect market refers to a theoretical construct where all participants have perfect information, goods are homogenous, there are no barriers to entry or exit, and prices are determined solely by supply and demand. It's an idealized model used for analysis,
Ezea
What is ceteris paribus?
Shukri Reply
other things being equal
AI-Robot
When MP₁ becomes negative, TP start to decline. Extuples Suppose that the short-run production function of certain cut-flower firm is given by: Q=4KL-0.6K2 - 0.112 • Where is quantity of cut flower produced, I is labour input and K is fixed capital input (K-5). Determine the average product of lab
Kelo
Extuples Suppose that the short-run production function of certain cut-flower firm is given by: Q=4KL-0.6K2 - 0.112 • Where is quantity of cut flower produced, I is labour input and K is fixed capital input (K-5). Determine the average product of labour (APL) and marginal product of labour (MPL)
Kelo
yes,thank you
Shukri
Can I ask you other question?
Shukri
what is monopoly mean?
Habtamu Reply
What is different between quantity demand and demand?
Shukri Reply
Quantity demanded refers to the specific amount of a good or service that consumers are willing and able to purchase at a give price and within a specific time period. Demand, on the other hand, is a broader concept that encompasses the entire relationship between price and quantity demanded
Ezea
ok
Shukri
how do you save a country economic situation when it's falling apart
Lilia Reply
what is the difference between economic growth and development
Fiker Reply
Economic growth as an increase in the production and consumption of goods and services within an economy.but Economic development as a broader concept that encompasses not only economic growth but also social & human well being.
Shukri
production function means
Jabir
What do you think is more important to focus on when considering inequality ?
Abdisa Reply
any question about economics?
Awais Reply
sir...I just want to ask one question... Define the term contract curve? if you are free please help me to find this answer 🙏
Asui
it is a curve that we get after connecting the pareto optimal combinations of two consumers after their mutually beneficial trade offs
Awais
thank you so much 👍 sir
Asui
In economics, the contract curve refers to the set of points in an Edgeworth box diagram where both parties involved in a trade cannot be made better off without making one of them worse off. It represents the Pareto efficient allocations of goods between two individuals or entities, where neither p
Cornelius
In economics, the contract curve refers to the set of points in an Edgeworth box diagram where both parties involved in a trade cannot be made better off without making one of them worse off. It represents the Pareto efficient allocations of goods between two individuals or entities,
Cornelius
Suppose a consumer consuming two commodities X and Y has The following utility function u=X0.4 Y0.6. If the price of the X and Y are 2 and 3 respectively and income Constraint is birr 50. A,Calculate quantities of x and y which maximize utility. B,Calculate value of Lagrange multiplier. C,Calculate quantities of X and Y consumed with a given price. D,alculate optimum level of output .
Feyisa Reply
Answer
Feyisa
c
Jabir
the market for lemon has 10 potential consumers, each having an individual demand curve p=101-10Qi, where p is price in dollar's per cup and Qi is the number of cups demanded per week by the i th consumer.Find the market demand curve using algebra. Draw an individual demand curve and the market dema
Gsbwnw Reply
suppose the production function is given by ( L, K)=L¼K¾.assuming capital is fixed find APL and MPL. consider the following short run production function:Q=6L²-0.4L³ a) find the value of L that maximizes output b)find the value of L that maximizes marginal product
Abdureman
types of unemployment
Yomi Reply
What is the difference between perfect competition and monopolistic competition?
Mohammed
Got questions? Join the online conversation and get instant answers!
Jobilize.com Reply

Get Jobilize Job Search Mobile App in your pocket Now!

Get it on Google Play Download on the App Store Now


Source:  OpenStax, Chemistry. OpenStax CNX. May 20, 2015 Download for free at http://legacy.cnx.org/content/col11760/1.9
Google Play and the Google Play logo are trademarks of Google Inc.

Notification Switch

Would you like to follow the 'Chemistry' conversation and receive update notifications?

Ask