<< Chapter < Page Chapter >> Page >
By the end of this section, you will be able to:
  • Distinguish between adhesive and cohesive forces
  • Define viscosity, surface tension, and capillary rise
  • Describe the roles of intermolecular attractive forces in each of these properties/phenomena

When you pour a glass of water, or fill a car with gasoline, you observe that water and gasoline flow freely. But when you pour syrup on pancakes or add oil to a car engine, you note that syrup and motor oil do not flow as readily. The viscosity    of a liquid is a measure of its resistance to flow. Water, gasoline, and other liquids that flow freely have a low viscosity. Honey, syrup, motor oil, and other liquids that do not flow freely, like those shown in [link] , have higher viscosities. We can measure viscosity by measuring the rate at which a metal ball falls through a liquid (the ball falls more slowly through a more viscous liquid) or by measuring the rate at which a liquid flows through a narrow tube (more viscous liquids flow more slowly).

Two photographs are shown and labeled “a” and “b.” Photo a shows a jar of honey with a dipper drizzling it onto a biscuit. More biscuits are shown in a basket in the background. Photo b shows the engine of a car and a person adding motor oil to the engine.
(a) Honey and (b) motor oil are examples of liquids with high viscosities; they flow slowly. (credit a: modification of work by Scott Bauer; credit b: modification of work by David Nagy)

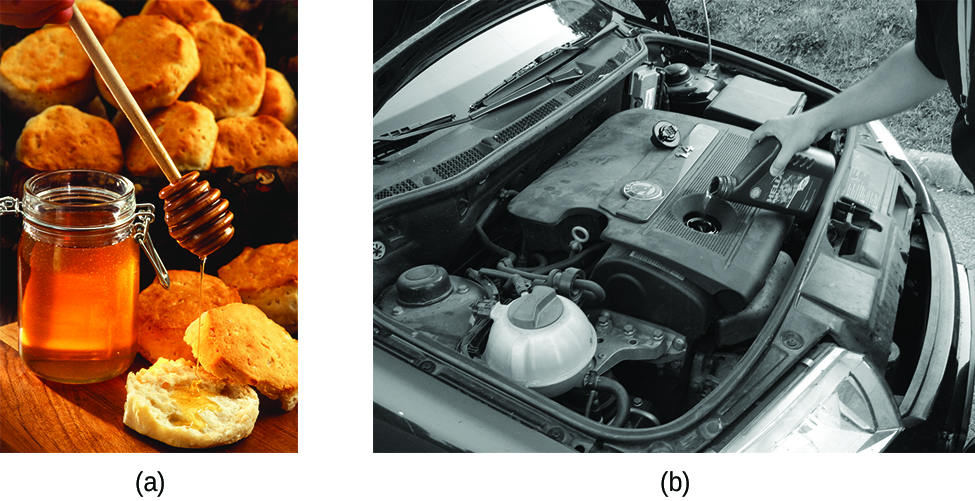
The IMFs between the molecules of a liquid, the size and shape of the molecules, and the temperature determine how easily a liquid flows. As [link] shows, the more structurally complex are the molecules in a liquid and the stronger the IMFs between them, the more difficult it is for them to move past each other and the greater is the viscosity of the liquid. As the temperature increases, the molecules move more rapidly and their kinetic energies are better able to overcome the forces that hold them together; thus, the viscosity of the liquid decreases.

Viscosities of Common Substances at 25 °C
Substance Formula Viscosity (mPa·s)
water H 2 O 0.890
mercury Hg 1.526
ethanol C 2 H 5 OH 1.074
octane C 8 H 18 0.508
ethylene glycol CH 2 (OH)CH 2 (OH) 16.1
honey variable ~2,000–10,000
motor oil variable ~50–500

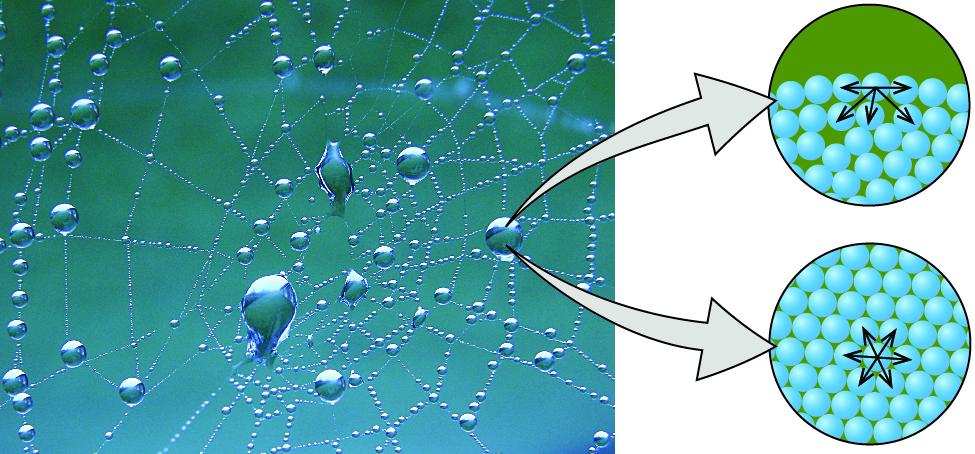
The various IMFs between identical molecules of a substance are examples of cohesive forces . The molecules within a liquid are surrounded by other molecules and are attracted equally in all directions by the cohesive forces within the liquid. However, the molecules on the surface of a liquid are attracted only by about one-half as many molecules. Because of the unbalanced molecular attractions on the surface molecules, liquids contract to form a shape that minimizes the number of molecules on the surface—that is, the shape with the minimum surface area. A small drop of liquid tends to assume a spherical shape, as shown in [link] , because in a sphere, the ratio of surface area to volume is at a minimum. Larger drops are more greatly affected by gravity, air resistance, surface interactions, and so on, and as a result, are less spherical.

A photo of a spider’s web with droplets of water attached to it is shown. Two images are shown the right of the photo and arrows lead from the photo to the images. The upper image shows twenty eight blue spheres stacked one atop the other in the bottom of a circular background. Five arrows are drawn pointing to the sides and downward from the sphere in the top middle of the drawing. The lower image shows another circular background of the same size as the first, but this time the blue spheres fill the image and are packed closely together. A sphere in the middle has six arrows pointing in all directions away from it.
Attractive forces result in a spherical water drop that minimizes surface area; cohesive forces hold the sphere together; adhesive forces keep the drop attached to the web. (credit photo: modification of work by “OliBac”/Flickr)

Questions & Answers

how do you get the 2/50
Abba Reply
number of sport play by 50 student construct discrete data
Aminu Reply
width of the frangebany leaves on how to write a introduction
Theresa Reply
Solve the mean of variance
Veronica Reply
Step 1: Find the mean. To find the mean, add up all the scores, then divide them by the number of scores. ... Step 2: Find each score's deviation from the mean. ... Step 3: Square each deviation from the mean. ... Step 4: Find the sum of squares. ... Step 5: Divide the sum of squares by n – 1 or N.
kenneth
what is error
Yakuba Reply
Is mistake done to something
Vutshila
Hy
anas
hy
What is the life teble
anas
hy
Jibrin
statistics is the analyzing of data
Tajudeen Reply
what is statics?
Zelalem Reply
how do you calculate mean
Gloria Reply
diveving the sum if all values
Shaynaynay
let A1,A2 and A3 events be independent,show that (A1)^c, (A2)^c and (A3)^c are independent?
Fisaye Reply
what is statistics
Akhisani Reply
data collected all over the world
Shaynaynay
construct a less than and more than table
Imad Reply
The sample of 16 students is taken. The average age in the sample was 22 years with astandard deviation of 6 years. Construct a 95% confidence interval for the age of the population.
Aschalew Reply
Bhartdarshan' is an internet-based travel agency wherein customer can see videos of the cities they plant to visit. The number of hits daily is a normally distributed random variable with a mean of 10,000 and a standard deviation of 2,400 a. what is the probability of getting more than 12,000 hits? b. what is the probability of getting fewer than 9,000 hits?
Akshay Reply
Bhartdarshan'is an internet-based travel agency wherein customer can see videos of the cities they plan to visit. The number of hits daily is a normally distributed random variable with a mean of 10,000 and a standard deviation of 2,400. a. What is the probability of getting more than 12,000 hits
Akshay
1
Bright
Sorry i want to learn more about this question
Bright
Someone help
Bright
a= 0.20233 b=0.3384
Sufiyan
a
Shaynaynay
How do I interpret level of significance?
Mohd Reply
It depends on your business problem or in Machine Learning you could use ROC- AUC cruve to decide the threshold value
Shivam
how skewness and kurtosis are used in statistics
Owen Reply
yes what is it
Taneeya
Got questions? Join the online conversation and get instant answers!
Jobilize.com Reply
Practice Key Terms 5

Get Jobilize Job Search Mobile App in your pocket Now!

Get it on Google Play Download on the App Store Now


Source:  OpenStax, Chemistry. OpenStax CNX. May 20, 2015 Download for free at http://legacy.cnx.org/content/col11760/1.9
Google Play and the Google Play logo are trademarks of Google Inc.

Notification Switch

Would you like to follow the 'Chemistry' conversation and receive update notifications?

Ask