<< Chapter < Page
  Chemistry   Page 1 / 1
Chapter >> Page >
Water Density (kg/m 3 ) at Different Temperatures (°C)
Temperature Data for t<0 °C are for supercooled water Density
0 999.8395
4 999.9720 (density maximum)
10 999.7026
15 999.1026
20 998.2071
22 997.7735
25 997.0479
30 995.6502
40 992.2
60 983.2
80 971.8
100 958.4
A line graph is titled “Density of Water as a Function of Temperature.” The x-axis is titled “Temperature, degrees Celsius,” and the y-axis is titled “Density, Kilograms per cubic meter.” A line connects plot points at the coordinates 0 and 999.8395, 4 and 999.9720, 10 and 999.7026, 15 and 999.1026, 20 and 998.2071, 22 and 997.7735, 25 and 997.0479, 30 and 995.6502, 40 and 992.2, 60 and 983.2, 80 and 971.8, and 100 and 958.4.
Water Vapor Pressure at Different Temperatures (°C)
Temperature Vapor Pressure (torr) Vapor Pressure (Pa)
0 4.6 613.2812
4 6.1 813.2642
10 9.2 1226.562
15 12.8 1706.522
20 17.5 2333.135
22 19.8 2639.776
25 23.8 3173.064
30 31.8 4239.64
35 42.2 5626.188
40 55.3 7372.707
45 71.9 9585.852
50 92.5 12332.29
55 118.0 15732
60 149.4 19918.31
65 187.5 24997.88
70 233.7 31157.35
75 289.1 38543.39
80 355.1 47342.64
85 433.6 57808.42
90 525.8 70100.71
95 633.9 84512.82
100 760.0 101324.7
A line graph is titled “Vapor Pressure as a Function of Temperature.” The x-axis is titled “Temperature, degrees Celsius,” and the y-axis is titled “Vapor pressure, torr.” A line connects plot points at the coordinates 0 and 4.6, 4 and 6.1, 10 and 9.2, 15 and 12.8, 20 and 17.5, 22 and 19.8, 25 and 23.8, 30 and 31.8, 35 and 42.2, 40 and 55.3, 45 and 71.9, 50 and 92.5, 55 and 118.0, 60 and 149.4, 65 and 187.5, 70 and 233.7, 75 and 289.1, 80 and 355.1, 85 and 433.6, 90 and 525.8, 95 and 633.9, and 100 and 760.0.
Water K w and pK w at Different Temperatures (°C)
Temperature K w 10 –14 pK w pK w = –log 10 (K w )
0 0.112 14.95
5 0.182 14.74
10 0.288 14.54
15 0.465 14.33
20 0.671 14.17
25 0.991 14.00
30 1.432 13.84
35 2.042 13.69
40 2.851 13.55
45 3.917 13.41
50 5.297 13.28
55 7.080 13.15
60 9.311 13.03
75 19.95 12.70
100 56.23 12.25
A line graph is titled “Water pK subscript W as a Function of Temperature.” The x-axis is titled “Temperature, degrees Celsius,” and the y-axis is titled “pK subscript W.” A line connects plot points at the coordinates 0 and 14.95, 5 and 14.74, 10 and 14.54, 15 and 14.33, 20 and 14.17, 25 and 14, 30 and 13.84, 35 and 13.69, 40 and 13.55, 45 and 13.41, 50 and 13.28, 55 and 13.15, 60 and 13.03, 75 and 12.7, and 100 and 12.25.
Specific Heat Capacity for Water
C°(H 2 O( l )) = 4184 J∙K −1 ∙kg −1 = 4.184 J∙g -1 ∙°C -1
C°(H 2 O( s )) = 1864 J∙K −1 ∙kg −1
C°(H 2 O( g )) = 2093 J∙K −1 ∙kg −1
Standard Water Melting and Boiling Temperatures and Enthalpies of the Transitions
Temperature (K) Δ H (kJ/mol)
melting 273.15 6.088
boiling 373.15 40.656 (44.016 at 298 K)
Water Cryoscopic (Freezing Point Depression) and Ebullioscopic (Boiling Point Elevation) Constants
K f = 1.86°C∙kg∙mol −1 (cryoscopic constant)
K b = 0.51°C∙kg∙mol −1 (ebullioscopic constant)
A line graph is titled “Water Full-Range Spectral Absorption Curve.” The x-axis is titled “Wavelength” and the y-axis is titled “Absorption ( 1 per meter ).” Evenly spaced tick marks on the x-axis denote 10 nanometers, 100 nanometers, 1 micrometer, 10 micrometers, 100 micrometers, 1 millimeter, and 10 millimeters. Evenly spaced tick marks on the y-axis denote 10 superscript negative two, 10 superscript negative one, 10 superscript zero, 10 superscript one, 10 superscript two, 10 superscript three, 10 superscript four, 10 superscript five, 10 superscript six, 10 superscript seven, and 10 superscript eight. Above the graph, horizontal lines indicate the range of wavelengths for U V, V I S, near I R , mid I R , far I R , and E H F. The graph contains one line that begins at 10 nanometers and a little more than 10 superscript six. Moving from left to right, this line ascends gradually until it reaches a point near 100 nanometers and 10 superscript eight. From this point, the line steeply descends to a point a little more than halfway between 100 nanometers and 1 micrometer, and slightly more than 10 superscript two. This point indicates the end of the range labeled “U V” and the beginning of the range labeled “V I S.” The range labeled “V I S” is shaded with a color spectrum including the full range of Roy G Biv colors. Here, the line briefly descends in the same path as before, and then steeply ascends to a point near 1 micrometer and 10 superscript zero. This point indicates the end of the range labeled “V I S” and the beginning of the range labeled “near I R.” The line continues its steep ascent, with short, abrupt descents in between, until it reaches a point a little more than halfway between 1 micrometer and 10 micrometers, and a little more than 10 superscript six. This point indicates the end of the range labeled “near I R” and the beginning of the range labeled “mid I R.” Here, the line moves steeply and sporadically up and down until it reaches a point a little more than halfway between 10 micrometers and 100 micrometers, and slightly more than 10 superscript five. This point indicates the end of the range labeled “Mid I R” and the beginning of the range labeled “Far I R.” The line descends very gradually to a point slightly more than 1 millimeter and slightly more than 10 superscript four. This point indicates the end of the range labeled “Far I R” and the beginning of the range labeled “E H F.” The line continues its gradual descent to 10 millimeters and slightly more than 10 superscript three. This point indicates the end of the range labeled “E H F.”
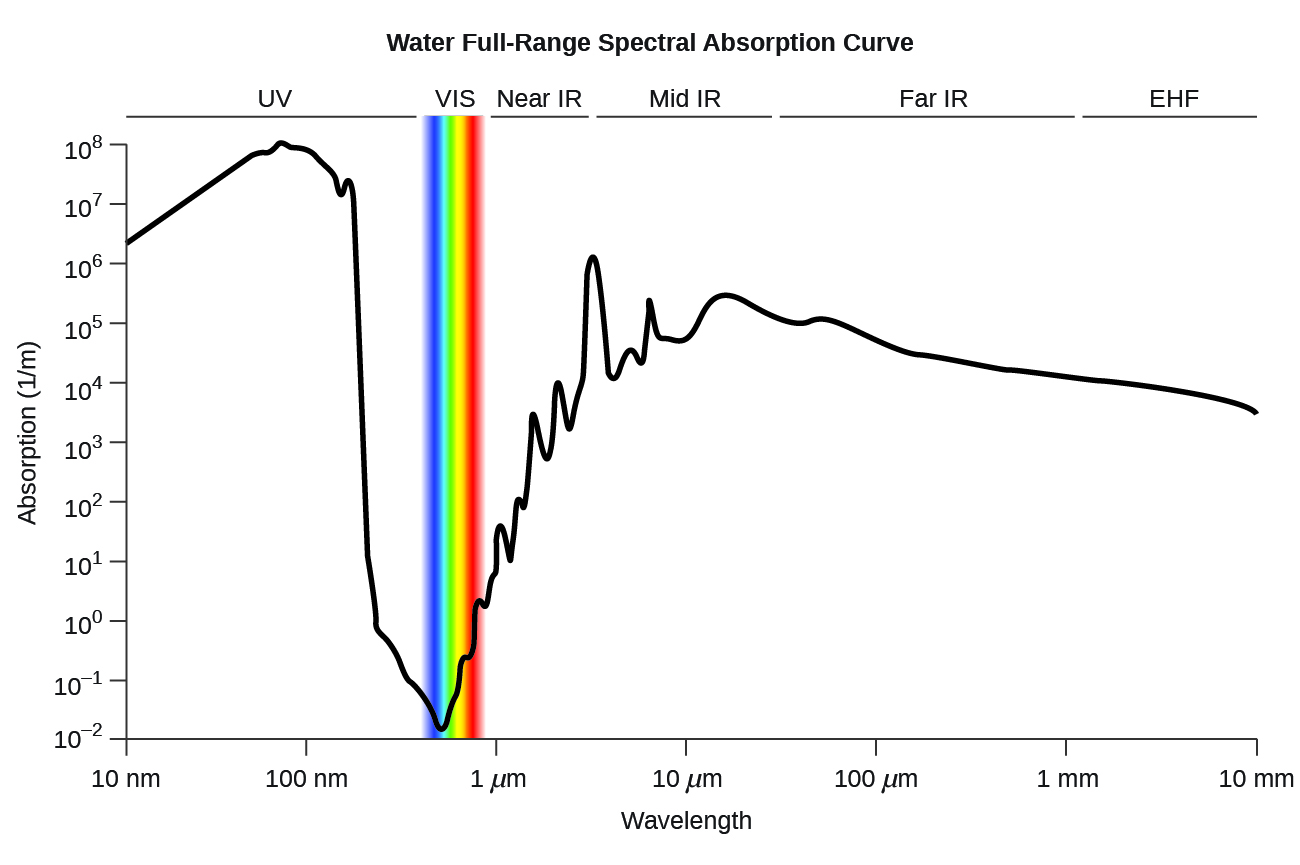
Water full-range spectral absorption curve. This curve shows the full-range spectral absorption for water. The y -axis signifies the absorption in 1/cm. If we divide 1 by this value, we will obtain the length of the path (in cm) after which the intensity of a light beam passing through water decays by a factor of the base of the natural logarithm e (e = 2.718281828).

Questions & Answers

A golfer on a fairway is 70 m away from the green, which sits below the level of the fairway by 20 m. If the golfer hits the ball at an angle of 40° with an initial speed of 20 m/s, how close to the green does she come?
Aislinn Reply
cm
tijani
what is titration
John Reply
what is physics
Siyaka Reply
A mouse of mass 200 g falls 100 m down a vertical mine shaft and lands at the bottom with a speed of 8.0 m/s. During its fall, how much work is done on the mouse by air resistance
Jude Reply
Can you compute that for me. Ty
Jude
what is the dimension formula of energy?
David Reply
what is viscosity?
David
what is inorganic
emma Reply
what is chemistry
Youesf Reply
what is inorganic
emma
Chemistry is a branch of science that deals with the study of matter,it composition,it structure and the changes it undergoes
Adjei
please, I'm a physics student and I need help in physics
Adjanou
chemistry could also be understood like the sexual attraction/repulsion of the male and female elements. the reaction varies depending on the energy differences of each given gender. + masculine -female.
Pedro
A ball is thrown straight up.it passes a 2.0m high window 7.50 m off the ground on it path up and takes 1.30 s to go past the window.what was the ball initial velocity
Krampah Reply
2. A sled plus passenger with total mass 50 kg is pulled 20 m across the snow (0.20) at constant velocity by a force directed 25° above the horizontal. Calculate (a) the work of the applied force, (b) the work of friction, and (c) the total work.
Sahid Reply
you have been hired as an espert witness in a court case involving an automobile accident. the accident involved car A of mass 1500kg which crashed into stationary car B of mass 1100kg. the driver of car A applied his brakes 15 m before he skidded and crashed into car B. after the collision, car A s
Samuel Reply
can someone explain to me, an ignorant high school student, why the trend of the graph doesn't follow the fact that the higher frequency a sound wave is, the more power it is, hence, making me think the phons output would follow this general trend?
Joseph Reply
Nevermind i just realied that the graph is the phons output for a person with normal hearing and not just the phons output of the sound waves power, I should read the entire thing next time
Joseph
Follow up question, does anyone know where I can find a graph that accuretly depicts the actual relative "power" output of sound over its frequency instead of just humans hearing
Joseph
"Generation of electrical energy from sound energy | IEEE Conference Publication | IEEE Xplore" ***ieeexplore.ieee.org/document/7150687?reload=true
Ryan
what's motion
Maurice Reply
what are the types of wave
Maurice
answer
Magreth
progressive wave
Magreth
hello friend how are you
Muhammad Reply
fine, how about you?
Mohammed
hi
Mujahid
A string is 3.00 m long with a mass of 5.00 g. The string is held taut with a tension of 500.00 N applied to the string. A pulse is sent down the string. How long does it take the pulse to travel the 3.00 m of the string?
yasuo Reply
Who can show me the full solution in this problem?
Reofrir Reply
Got questions? Join the online conversation and get instant answers!
Jobilize.com Reply

Get Jobilize Job Search Mobile App in your pocket Now!

Get it on Google Play Download on the App Store Now


Source:  OpenStax, Chemistry. OpenStax CNX. May 20, 2015 Download for free at http://legacy.cnx.org/content/col11760/1.9
Google Play and the Google Play logo are trademarks of Google Inc.

Notification Switch

Would you like to follow the 'Chemistry' conversation and receive update notifications?

Ask