<< Chapter < Page
  Chemistry   Page 1 / 1
Chapter >> Page >
Water Density (kg/m 3 ) at Different Temperatures (°C)
Temperature Data for t<0 °C are for supercooled water Density
0 999.8395
4 999.9720 (density maximum)
10 999.7026
15 999.1026
20 998.2071
22 997.7735
25 997.0479
30 995.6502
40 992.2
60 983.2
80 971.8
100 958.4
A line graph is titled “Density of Water as a Function of Temperature.” The x-axis is titled “Temperature, degrees Celsius,” and the y-axis is titled “Density, Kilograms per cubic meter.” A line connects plot points at the coordinates 0 and 999.8395, 4 and 999.9720, 10 and 999.7026, 15 and 999.1026, 20 and 998.2071, 22 and 997.7735, 25 and 997.0479, 30 and 995.6502, 40 and 992.2, 60 and 983.2, 80 and 971.8, and 100 and 958.4.
Water Vapor Pressure at Different Temperatures (°C)
Temperature Vapor Pressure (torr) Vapor Pressure (Pa)
0 4.6 613.2812
4 6.1 813.2642
10 9.2 1226.562
15 12.8 1706.522
20 17.5 2333.135
22 19.8 2639.776
25 23.8 3173.064
30 31.8 4239.64
35 42.2 5626.188
40 55.3 7372.707
45 71.9 9585.852
50 92.5 12332.29
55 118.0 15732
60 149.4 19918.31
65 187.5 24997.88
70 233.7 31157.35
75 289.1 38543.39
80 355.1 47342.64
85 433.6 57808.42
90 525.8 70100.71
95 633.9 84512.82
100 760.0 101324.7
A line graph is titled “Vapor Pressure as a Function of Temperature.” The x-axis is titled “Temperature, degrees Celsius,” and the y-axis is titled “Vapor pressure, torr.” A line connects plot points at the coordinates 0 and 4.6, 4 and 6.1, 10 and 9.2, 15 and 12.8, 20 and 17.5, 22 and 19.8, 25 and 23.8, 30 and 31.8, 35 and 42.2, 40 and 55.3, 45 and 71.9, 50 and 92.5, 55 and 118.0, 60 and 149.4, 65 and 187.5, 70 and 233.7, 75 and 289.1, 80 and 355.1, 85 and 433.6, 90 and 525.8, 95 and 633.9, and 100 and 760.0.
Water K w and pK w at Different Temperatures (°C)
Temperature K w 10 –14 pK w pK w = –log 10 (K w )
0 0.112 14.95
5 0.182 14.74
10 0.288 14.54
15 0.465 14.33
20 0.671 14.17
25 0.991 14.00
30 1.432 13.84
35 2.042 13.69
40 2.851 13.55
45 3.917 13.41
50 5.297 13.28
55 7.080 13.15
60 9.311 13.03
75 19.95 12.70
100 56.23 12.25
A line graph is titled “Water pK subscript W as a Function of Temperature.” The x-axis is titled “Temperature, degrees Celsius,” and the y-axis is titled “pK subscript W.” A line connects plot points at the coordinates 0 and 14.95, 5 and 14.74, 10 and 14.54, 15 and 14.33, 20 and 14.17, 25 and 14, 30 and 13.84, 35 and 13.69, 40 and 13.55, 45 and 13.41, 50 and 13.28, 55 and 13.15, 60 and 13.03, 75 and 12.7, and 100 and 12.25.
Specific Heat Capacity for Water
C°(H 2 O( l )) = 4184 J∙K −1 ∙kg −1 = 4.184 J∙g -1 ∙°C -1
C°(H 2 O( s )) = 1864 J∙K −1 ∙kg −1
C°(H 2 O( g )) = 2093 J∙K −1 ∙kg −1
Standard Water Melting and Boiling Temperatures and Enthalpies of the Transitions
Temperature (K) Δ H (kJ/mol)
melting 273.15 6.088
boiling 373.15 40.656 (44.016 at 298 K)
Water Cryoscopic (Freezing Point Depression) and Ebullioscopic (Boiling Point Elevation) Constants
K f = 1.86°C∙kg∙mol −1 (cryoscopic constant)
K b = 0.51°C∙kg∙mol −1 (ebullioscopic constant)
A line graph is titled “Water Full-Range Spectral Absorption Curve.” The x-axis is titled “Wavelength” and the y-axis is titled “Absorption ( 1 per meter ).” Evenly spaced tick marks on the x-axis denote 10 nanometers, 100 nanometers, 1 micrometer, 10 micrometers, 100 micrometers, 1 millimeter, and 10 millimeters. Evenly spaced tick marks on the y-axis denote 10 superscript negative two, 10 superscript negative one, 10 superscript zero, 10 superscript one, 10 superscript two, 10 superscript three, 10 superscript four, 10 superscript five, 10 superscript six, 10 superscript seven, and 10 superscript eight. Above the graph, horizontal lines indicate the range of wavelengths for U V, V I S, near I R , mid I R , far I R , and E H F. The graph contains one line that begins at 10 nanometers and a little more than 10 superscript six. Moving from left to right, this line ascends gradually until it reaches a point near 100 nanometers and 10 superscript eight. From this point, the line steeply descends to a point a little more than halfway between 100 nanometers and 1 micrometer, and slightly more than 10 superscript two. This point indicates the end of the range labeled “U V” and the beginning of the range labeled “V I S.” The range labeled “V I S” is shaded with a color spectrum including the full range of Roy G Biv colors. Here, the line briefly descends in the same path as before, and then steeply ascends to a point near 1 micrometer and 10 superscript zero. This point indicates the end of the range labeled “V I S” and the beginning of the range labeled “near I R.” The line continues its steep ascent, with short, abrupt descents in between, until it reaches a point a little more than halfway between 1 micrometer and 10 micrometers, and a little more than 10 superscript six. This point indicates the end of the range labeled “near I R” and the beginning of the range labeled “mid I R.” Here, the line moves steeply and sporadically up and down until it reaches a point a little more than halfway between 10 micrometers and 100 micrometers, and slightly more than 10 superscript five. This point indicates the end of the range labeled “Mid I R” and the beginning of the range labeled “Far I R.” The line descends very gradually to a point slightly more than 1 millimeter and slightly more than 10 superscript four. This point indicates the end of the range labeled “Far I R” and the beginning of the range labeled “E H F.” The line continues its gradual descent to 10 millimeters and slightly more than 10 superscript three. This point indicates the end of the range labeled “E H F.”
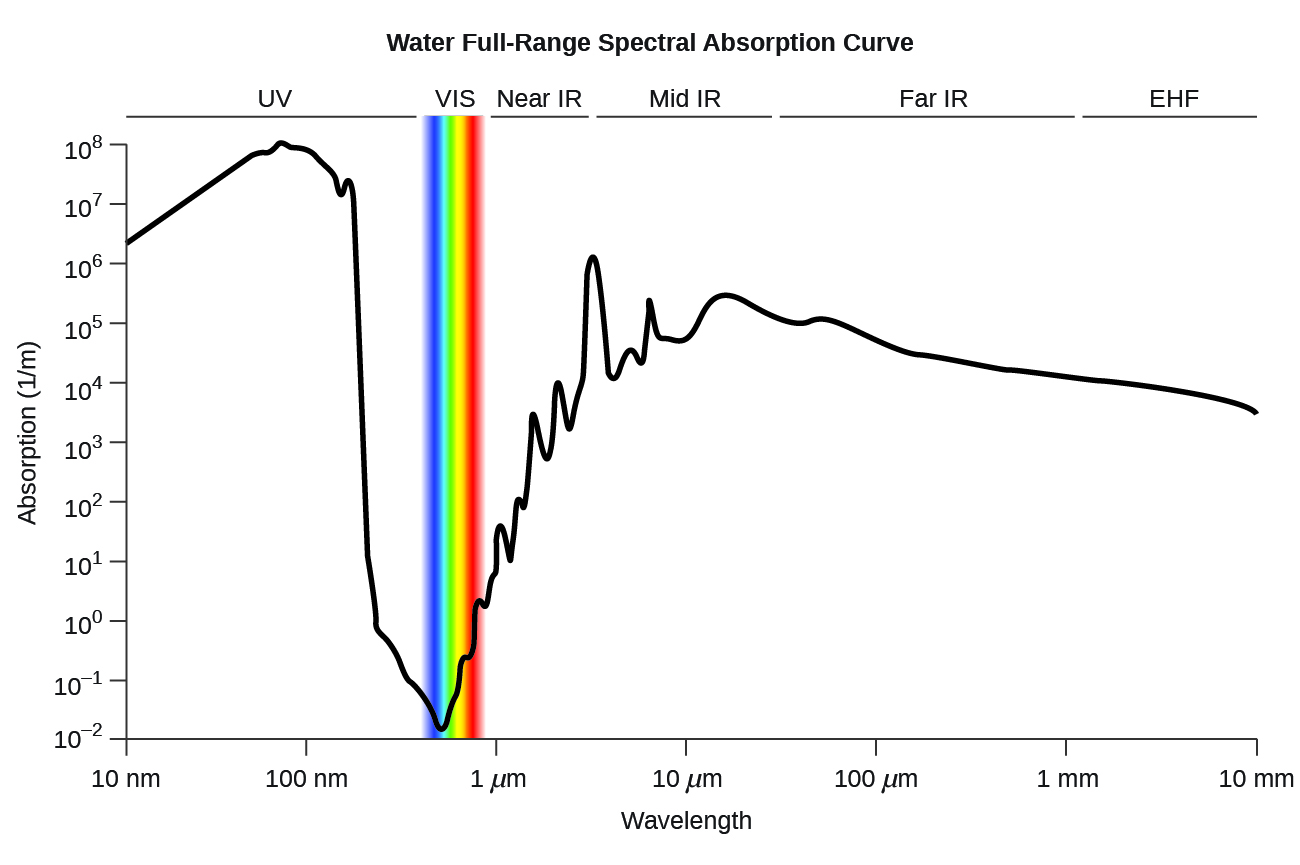
Water full-range spectral absorption curve. This curve shows the full-range spectral absorption for water. The y -axis signifies the absorption in 1/cm. If we divide 1 by this value, we will obtain the length of the path (in cm) after which the intensity of a light beam passing through water decays by a factor of the base of the natural logarithm e (e = 2.718281828).

Questions & Answers

if three forces F1.f2 .f3 act at a point on a Cartesian plane in the daigram .....so if the question says write down the x and y components ..... I really don't understand
Syamthanda Reply
hey , can you please explain oxidation reaction & redox ?
Boitumelo Reply
hey , can you please explain oxidation reaction and redox ?
Boitumelo
for grade 12 or grade 11?
Sibulele
the value of V1 and V2
Tumelo Reply
advantages of electrons in a circuit
Rethabile Reply
we're do you find electromagnetism past papers
Ntombifuthi
what a normal force
Tholulwazi Reply
it is the force or component of the force that the surface exert on an object incontact with it and which acts perpendicular to the surface
Sihle
what is physics?
Petrus Reply
what is the half reaction of Potassium and chlorine
Anna Reply
how to calculate coefficient of static friction
Lisa Reply
how to calculate static friction
Lisa
How to calculate a current
Tumelo
how to calculate the magnitude of horizontal component of the applied force
Mogano
How to calculate force
Monambi
a structure of a thermocouple used to measure inner temperature
Anna Reply
a fixed gas of a mass is held at standard pressure temperature of 15 degrees Celsius .Calculate the temperature of the gas in Celsius if the pressure is changed to 2×10 to the power 4
Amahle Reply
How is energy being used in bonding?
Raymond Reply
what is acceleration
Syamthanda Reply
a rate of change in velocity of an object whith respect to time
Khuthadzo
how can we find the moment of torque of a circular object
Kidist
Acceleration is a rate of change in velocity.
Justice
t =r×f
Khuthadzo
how to calculate tension by substitution
Precious Reply
hi
Shongi
hi
Leago
use fnet method. how many obects are being calculated ?
Khuthadzo
khuthadzo hii
Hulisani
how to calculate acceleration and tension force
Lungile Reply
you use Fnet equals ma , newtoms second law formula
Masego
please help me with vectors in two dimensions
Mulaudzi Reply
how to calculate normal force
Mulaudzi
Got questions? Join the online conversation and get instant answers!
Jobilize.com Reply

Get Jobilize Job Search Mobile App in your pocket Now!

Get it on Google Play Download on the App Store Now


Source:  OpenStax, Chemistry. OpenStax CNX. May 20, 2015 Download for free at http://legacy.cnx.org/content/col11760/1.9
Google Play and the Google Play logo are trademarks of Google Inc.

Notification Switch

Would you like to follow the 'Chemistry' conversation and receive update notifications?

Ask