<< Chapter < Page Chapter >> Page >

Business Fundamentals was developed by the Global Text Project, which is working to create open-content electronictextbooks that are freely available on the website http://globaltext.terry.uga.edu. Distribution is also possible viapaper, CD, DVD, and via this collaboration, through Connexions. The goal is to make textbooks available to the manywho cannot afford them. For more information on getting involved with the Global Text Project or Connexions email us atdrexel@uga.edu and dcwill@cnx.org.

Translated and reprinted with permission from Dowling/Drumm Gründungsmanagement (Entrepreneurship) Springer Verlag, 2003.

Editors: Michael Dowling, Hans Juergen Drumm (University of Regensberg)

Reviewer: Timothy B Folta (Purdue University)

Definition and statistics

We start by defining what we mean by growth and growth-oriented firms. Criteria such as growth in the number of employees, or sales growth are generally used by researchers. The Kaufmann Center for Entrepreneurial Leadership, a leading institute of entrepreneurial research in the USA, for example, defines high-growth firms as being those with over 30 per cent growth in sales or over 20 per cent growth in the number of employees for each of the three preceding years. Other US researchers (Siegel/MacMillan 1993) define strong growth as over 25 per cent growth per annum over a three-year period.

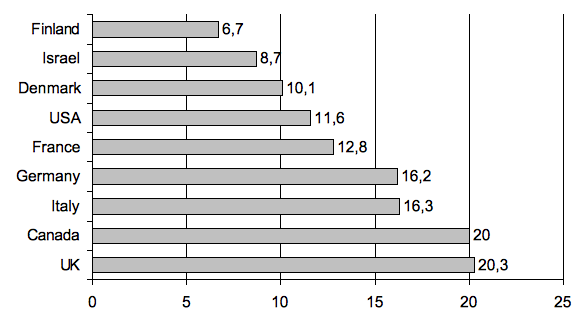
The number of high-growth firms is no doubt limited. Even in the USA, only 5 per cent of firms each year are estimated to take on extra staff (cf. Sexton/Bowman-Upton 1991, p. 12). However, these fast-growing firms have a disproportionate significance for the increase in the number of jobs. In the USA, for example, it is estimated that only 12-15 per cent of all businesses are responsible for 100 per cent of the employment growth in the US economy (cf. Sexton/Bowman-Upton 1991, p. 10). Research studies in Germany have also shown that businesses with 50 to 250 employees recorded the greatest increase in employment (cf. Kühlhorn/Wissdorf 2001). International comparative data can be found in the Global Entrepreneurship Monitor (GEM). Based on a survey of all start-ups from 1999, the GEM presented the share of high-growth start-ups (see Exhibit 1). (cf. Sternberg 2000).

A chart of many different countries and their quantity of start-ups.
Countries in comparison: Share of high-growth start-ups compared to total start-ups. ( Source : Sternberg 2000)

Growth models

In the field of entrepreneurship research, life cycle models are often used to describe the entrepreneurial process. These models are also used in research into growth problems. Kazanjian and Drazin (1980), for example, developed a four-phase growth model, and identified the typical growth problems of fast-growing firms in each phase.

Phase 1, Concept and development: Focus on the invention and development of a service or product. Main problems:

  • developing the idea
  • testing a prototype
  • finding investment support for the idea

Phase 2, Commercialization: Developing the product for introduction to the market. Main problems:

  • setting up the organization and production
  • solving technical problems
  • market entry

Questions & Answers

how do you get the 2/50
Abba Reply
number of sport play by 50 student construct discrete data
Aminu Reply
width of the frangebany leaves on how to write a introduction
Theresa Reply
Solve the mean of variance
Veronica Reply
Step 1: Find the mean. To find the mean, add up all the scores, then divide them by the number of scores. ... Step 2: Find each score's deviation from the mean. ... Step 3: Square each deviation from the mean. ... Step 4: Find the sum of squares. ... Step 5: Divide the sum of squares by n – 1 or N.
kenneth
what is error
Yakuba Reply
Is mistake done to something
Vutshila
Hy
anas
hy
What is the life teble
anas
hy
Jibrin
statistics is the analyzing of data
Tajudeen Reply
what is statics?
Zelalem Reply
how do you calculate mean
Gloria Reply
diveving the sum if all values
Shaynaynay
let A1,A2 and A3 events be independent,show that (A1)^c, (A2)^c and (A3)^c are independent?
Fisaye Reply
what is statistics
Akhisani Reply
data collected all over the world
Shaynaynay
construct a less than and more than table
Imad Reply
The sample of 16 students is taken. The average age in the sample was 22 years with astandard deviation of 6 years. Construct a 95% confidence interval for the age of the population.
Aschalew Reply
Bhartdarshan' is an internet-based travel agency wherein customer can see videos of the cities they plant to visit. The number of hits daily is a normally distributed random variable with a mean of 10,000 and a standard deviation of 2,400 a. what is the probability of getting more than 12,000 hits? b. what is the probability of getting fewer than 9,000 hits?
Akshay Reply
Bhartdarshan'is an internet-based travel agency wherein customer can see videos of the cities they plan to visit. The number of hits daily is a normally distributed random variable with a mean of 10,000 and a standard deviation of 2,400. a. What is the probability of getting more than 12,000 hits
Akshay
1
Bright
Sorry i want to learn more about this question
Bright
Someone help
Bright
a= 0.20233 b=0.3384
Sufiyan
a
Shaynaynay
How do I interpret level of significance?
Mohd Reply
It depends on your business problem or in Machine Learning you could use ROC- AUC cruve to decide the threshold value
Shivam
how skewness and kurtosis are used in statistics
Owen Reply
yes what is it
Taneeya
Got questions? Join the online conversation and get instant answers!
Jobilize.com Reply

Get Jobilize Job Search Mobile App in your pocket Now!

Get it on Google Play Download on the App Store Now


Source:  OpenStax, Business fundamentals. OpenStax CNX. Oct 08, 2010 Download for free at http://cnx.org/content/col11227/1.4
Google Play and the Google Play logo are trademarks of Google Inc.

Notification Switch

Would you like to follow the 'Business fundamentals' conversation and receive update notifications?

Ask