<< Chapter < Page Chapter >> Page >
 The life cycle of a tapeworm begins when eggs or tapeworm segments in the feces are ingested by pigs or humans. The embryos hatch, penetrate the intestinal wall, and circulate to the musculature in both pigs and humans. This figure shows how humans may acquire a tapeworm infection by ingesting raw or undercooked meat. Infection may results in cysts in the musculature, or in tapeworms in the intestine. Tapeworms attach themselves to the intestine via a hook-like structure called the scolex. Tapeworm segments and eggs are excreted in the feces, completing the cycle.
This diagram shows the life cycle of the tapeworm, a human worm parasite. (credit: modification of work by CDC)

Concept in action

To learn more about “Symbiosis in the Sea,” watch this webisode of Jonathan Bird’s Blue World.

Characteristics of communities

Communities are complex systems that can be characterized by their structure (the number and size of populations and their interactions) and dynamics (how the members and their interactions change over time). Understanding community structure and dynamics allows us to minimize impacts on ecosystems and manage ecological communities we benefit from.

Biodiversity

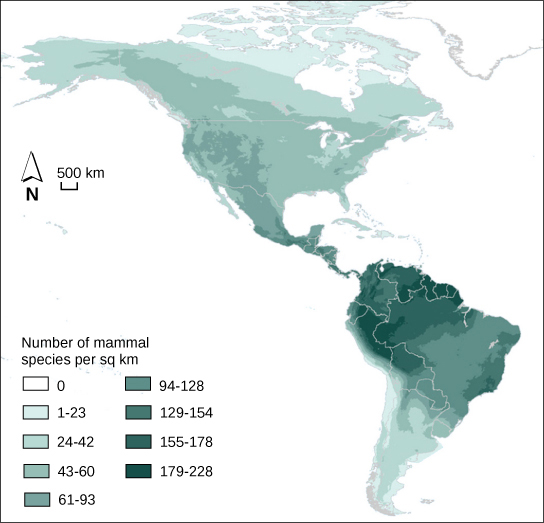
Ecologists have extensively studied one of the fundamental characteristics of communities: biodiversity. One measure of biodiversity used by ecologists is the number of different species in a particular area and their relative abundance. The area in question could be a habitat, a biome, or the entire biosphere. Species richness is the term used to describe the number of species living in a habitat or other unit. Species richness varies across the globe ( [link] ). Ecologists have struggled to understand the determinants of biodiversity. Species richness is related to latitude: the greatest species richness occurs near the equator and the lowest richness occurs near the poles. Other factors influence species richness as well. Island biogeography attempts to explain the great species richness found in isolated islands, and has found relationships between species richness, island size, and distance from the mainland.

Relative species abundance is the number individuals in a species relative to the total number of individuals in all species within a system. Foundation species, described below, often have the highest relative abundance of species.

 Map shows the special distribution of mammal species richness in North and South America. The highest number of mammal species, 179-228 per square kilometer, occurs in the Amazon region of South America. Species richness is generally highest in tropical latitudes, and then decreases to the north and south, and is at zero in the Arctic regions.
The greatest species richness for mammals in North America is associated in the equatorial latitudes. (credit: modification of work by NASA, CIESIN, Columbia University)

Foundation species

Foundation species are considered the “base” or “bedrock” of a community, having the greatest influence on its overall structure. They are often primary producers, and they are typically an abundant organism. For example, kelp, a species of brown algae, is a foundation species that forms the basis of the kelp forests off the coast of California.

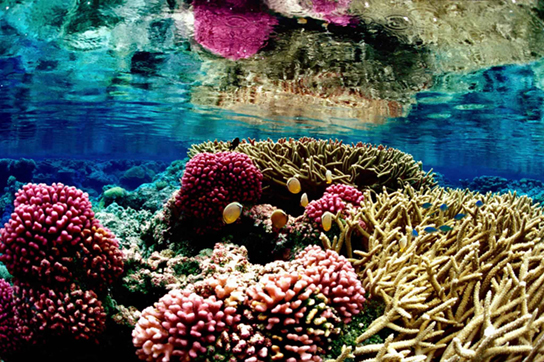
Foundation species may physically modify the environment to produce and maintain habitats that benefit the other organisms that use them. Examples include the kelp described above or tree species found in a forest. The photosynthetic corals of the coral reef also provide structure by physically modifying the environment ( [link] ). The exoskeletons of living and dead coral make up most of the reef structure, which protects many other species from waves and ocean currents.

 Photo shows pink brain-like coral and long, finger-like coral growing on a reef. Fish swim among the coral.
Coral is the foundation species of coral reef ecosystems. (credit: Jim E. Maragos, USFWS)

Keystone species

A keystone species    is one whose presence has inordinate influence in maintaining the prevalence of various species in an ecosystem, the ecological community’s structure, and sometimes its biodiversity. Pisaster ochraceus , the intertidal sea star, is a keystone species in the northwestern portion of the United States ( [link] ). Studies have shown that when this organism is removed from communities, mussel populations (their natural prey) increase, which completely alters the species composition and reduces biodiversity. Another keystone species is the banded tetra, a fish in tropical streams, which supplies nearly all of the phosphorus, a necessary inorganic nutrient, to the rest of the community. The banded tetra feeds largely on insects from the terrestrial ecosystem and then excretes phosphorus into the aquatic ecosystem. The relationships between populations in the community, and possibly the biodiversity, would change dramatically if these fish were to become extinct.

Questions & Answers

differentiate between demand and supply giving examples
Lambiv Reply
differentiated between demand and supply using examples
Lambiv
what is labour ?
Lambiv
how will I do?
Venny Reply
how is the graph works?I don't fully understand
Rezat Reply
information
Eliyee
devaluation
Eliyee
t
WARKISA
hi guys good evening to all
Lambiv
multiple choice question
Aster Reply
appreciation
Eliyee
explain perfect market
Lindiwe Reply
In economics, a perfect market refers to a theoretical construct where all participants have perfect information, goods are homogenous, there are no barriers to entry or exit, and prices are determined solely by supply and demand. It's an idealized model used for analysis,
Ezea
What is ceteris paribus?
Shukri Reply
other things being equal
AI-Robot
When MP₁ becomes negative, TP start to decline. Extuples Suppose that the short-run production function of certain cut-flower firm is given by: Q=4KL-0.6K2 - 0.112 • Where is quantity of cut flower produced, I is labour input and K is fixed capital input (K-5). Determine the average product of lab
Kelo
Extuples Suppose that the short-run production function of certain cut-flower firm is given by: Q=4KL-0.6K2 - 0.112 • Where is quantity of cut flower produced, I is labour input and K is fixed capital input (K-5). Determine the average product of labour (APL) and marginal product of labour (MPL)
Kelo
yes,thank you
Shukri
Can I ask you other question?
Shukri
what is monopoly mean?
Habtamu Reply
What is different between quantity demand and demand?
Shukri Reply
Quantity demanded refers to the specific amount of a good or service that consumers are willing and able to purchase at a give price and within a specific time period. Demand, on the other hand, is a broader concept that encompasses the entire relationship between price and quantity demanded
Ezea
ok
Shukri
how do you save a country economic situation when it's falling apart
Lilia Reply
what is the difference between economic growth and development
Fiker Reply
Economic growth as an increase in the production and consumption of goods and services within an economy.but Economic development as a broader concept that encompasses not only economic growth but also social & human well being.
Shukri
production function means
Jabir
What do you think is more important to focus on when considering inequality ?
Abdisa Reply
any question about economics?
Awais Reply
sir...I just want to ask one question... Define the term contract curve? if you are free please help me to find this answer 🙏
Asui
it is a curve that we get after connecting the pareto optimal combinations of two consumers after their mutually beneficial trade offs
Awais
thank you so much 👍 sir
Asui
In economics, the contract curve refers to the set of points in an Edgeworth box diagram where both parties involved in a trade cannot be made better off without making one of them worse off. It represents the Pareto efficient allocations of goods between two individuals or entities, where neither p
Cornelius
In economics, the contract curve refers to the set of points in an Edgeworth box diagram where both parties involved in a trade cannot be made better off without making one of them worse off. It represents the Pareto efficient allocations of goods between two individuals or entities,
Cornelius
Suppose a consumer consuming two commodities X and Y has The following utility function u=X0.4 Y0.6. If the price of the X and Y are 2 and 3 respectively and income Constraint is birr 50. A,Calculate quantities of x and y which maximize utility. B,Calculate value of Lagrange multiplier. C,Calculate quantities of X and Y consumed with a given price. D,alculate optimum level of output .
Feyisa Reply
Answer
Feyisa
c
Jabir
the market for lemon has 10 potential consumers, each having an individual demand curve p=101-10Qi, where p is price in dollar's per cup and Qi is the number of cups demanded per week by the i th consumer.Find the market demand curve using algebra. Draw an individual demand curve and the market dema
Gsbwnw Reply
suppose the production function is given by ( L, K)=L¼K¾.assuming capital is fixed find APL and MPL. consider the following short run production function:Q=6L²-0.4L³ a) find the value of L that maximizes output b)find the value of L that maximizes marginal product
Abdureman
types of unemployment
Yomi Reply
What is the difference between perfect competition and monopolistic competition?
Mohammed
Got questions? Join the online conversation and get instant answers!
Jobilize.com Reply

Get Jobilize Job Search Mobile App in your pocket Now!

Get it on Google Play Download on the App Store Now


Source:  OpenStax, Concepts of biology. OpenStax CNX. Feb 29, 2016 Download for free at http://cnx.org/content/col11487/1.9
Google Play and the Google Play logo are trademarks of Google Inc.

Notification Switch

Would you like to follow the 'Concepts of biology' conversation and receive update notifications?

Ask