

| << Chapter < Page | Chapter >> Page > |
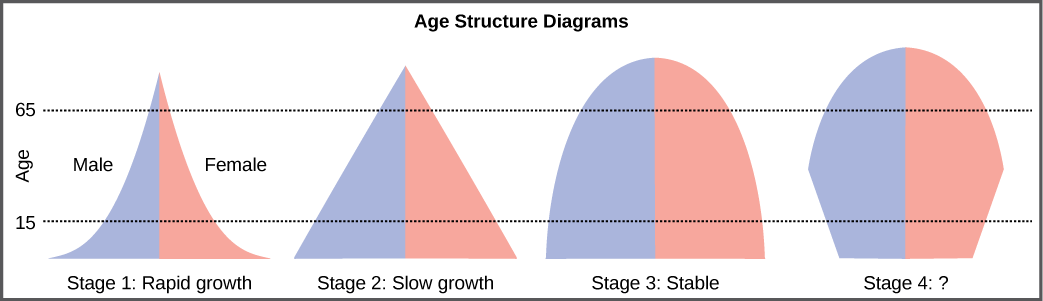
Age structure diagrams for rapidly growing, slow growing, and stable populations are shown in stages 1 through 3. What type of population change do you think stage 4 represents?
Many dire predictions have been made about the world’s population leading to a major crisis called the “population explosion.” In the 1968 book The Population Bomb , biologist Dr. Paul R. Ehrlich wrote, “The battle to feed all of humanity is over. In the 1970s hundreds of millions of people will starve to death in spite of any crash programs embarked upon now. At this late date nothing can prevent a substantial increase in the world death rate.” Paul R. Erlich, prologue to The Population Bomb , (1968; repr., New York: Ballantine, 1970). While many critics view this statement as an exaggeration, the laws of exponential population growth are still in effect, and unchecked human population growth cannot continue indefinitely.
Efforts to moderate population control led to the one-child policy in China, which imposes fines on urban couples who have more than one child. Due to the fact that some couples wish to have a male heir, many Chinese couples continue to have more than one child. The effectiveness of the policy in limiting overall population growth is controversial, as is the policy itself. Moreover, there are stories of female infanticide having occurred in some of the more rural areas of the country. Family planning education programs in other countries have had highly positive effects on limiting population growth rates and increasing standards of living. In spite of population control policies, the human population continues to grow. Because of the subsequent need to produce more and more food to feed our population, inequalities in access to food and other resources will continue to widen. The United Nations estimates the future world population size could vary from 6 billion (a decrease) to 16 billion people by the year 2100. There is no way to know whether human population growth will moderate to the point where the crisis described by Dr. Ehrlich will be averted.
Another consequence of population growth is the change and degradation of the natural environment. Many countries have attempted to reduce the human impact on climate change by limiting their emission of greenhouse gases. However, a global climate change treaty remains elusive, and many underdeveloped countries trying to improve their economic condition may be less likely to agree with such provisions without compensation if it means slowing their economic development. Furthermore, the role of human activity in causing climate change has become a hotly debated socio-political issue in some developed countries, including the United States. Thus, we enter the future with considerable uncertainty about our ability to curb human population growth and protect our environment to maintain the carrying capacity for the human species.
Visit this website and select “Launch the movie” for an animation discussing the global impacts of human population growth.
Earth’s human population is growing exponentially. Humans have increased their carrying capacity through technology, urbanization, and harnessing the energy of fossil fuels. The age structure of a population allows us to predict population growth. Unchecked human population growth could have dire long-term effects on human welfare and Earth’s ecosystems.
[link] Age structure diagrams for rapidly growing, slow growing, and stable populations are shown in stages 1 through 3. What type of population change do you think stage 4 represents?
[link] Stage 4 represents a population that is decreasing.
Notification Switch
Would you like to follow the 'Concepts of biology' conversation and receive update notifications?

|
|

|
|

|
|

|
|

|
|

|
|

|
|

|
|

|
|

|
|

|