

| << Chapter < Page | Chapter >> Page > |
Mendel studied traits with only one mode of inheritance in pea plants. The inheritance of the traits he studied all followed the relatively simple pattern of dominant and recessive alleles for a single characteristic. There are several important modes of inheritance, discovered after Mendel’s work, that do not follow the dominant and recessive, single-gene model.
Mendel’s experiments with pea plants suggested that: 1) two types of “units” or alleles exist for every gene; 2) alleles maintain their integrity in each generation (no blending); and 3) in the presence of the dominant allele, the recessive allele is hidden, with no contribution to the phenotype. Therefore, recessive alleles can be “carried” and not expressed by individuals. Such heterozygous individuals are sometimes referred to as “carriers.” Since then, genetic studies in other organisms have shown that much more complexity exists, but that the fundamental principles of Mendelian genetics still hold true. In the sections to follow, we consider some of the extensions of Mendelism.
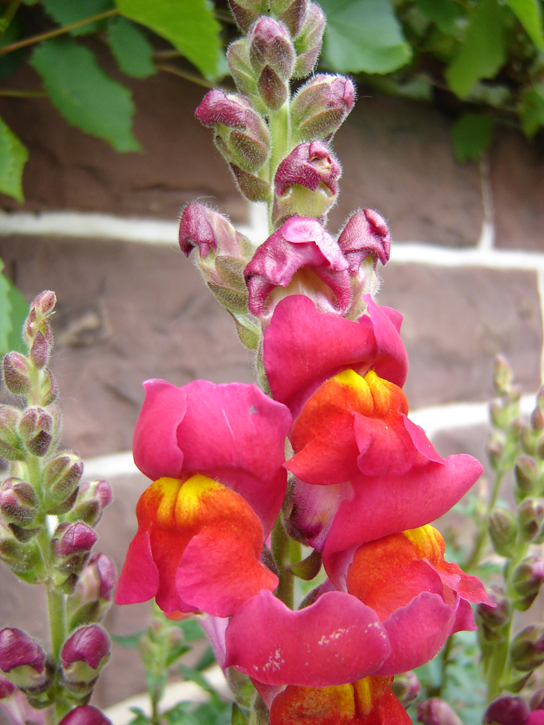
Mendel’s results, demonstrating that traits are inherited as dominant and recessive pairs, contradicted the view at that time that offspring exhibited a blend of their parents’ traits. However, the heterozygote phenotype occasionally does appear to be intermediate between the two parents. For example, in the snapdragon, Antirrhinum majus ( [link] ), a cross between a homozygous parent with white flowers ( C W C W ) and a homozygous parent with red flowers ( C R C R ) will produce offspring with pink flowers ( C R C W ). (Note that different genotypic abbreviations are used for Mendelian extensions to distinguish these patterns from simple dominance and recessiveness.) This pattern of inheritance is described as incomplete dominance , meaning that one of the alleles appears in the phenotype in the heterozygote, but not to the exclusion of the other, which can also be seen. The allele for red flowers is incompletely dominant over the allele for white flowers. However, the results of a heterozygote self-cross can still be predicted, just as with Mendelian dominant and recessive crosses. In this case, the genotypic ratio would be 1 C R C R :2 C R C W :1 C W C W , and the phenotypic ratio would be 1:2:1 for red:pink:white. The basis for the intermediate color in the heterozygote is simply that the pigment produced by the red allele (anthocyanin) is diluted in the heterozygote and therefore appears pink because of the white background of the flower petals.
A variation on incomplete dominance is codominance , in which both alleles for the same characteristic are simultaneously expressed in the heterozygote. An example of codominance occurs in the ABO blood groups of humans. The A and B alleles are expressed in the form of A or B molecules present on the surface of red blood cells. Homozygotes ( I A I A and I B I B ) express either the A or the B phenotype, and heterozygotes ( I A I B ) express both phenotypes equally. The I A I B individual has blood type AB. In a self-cross between heterozygotes expressing a codominant trait, the three possible offspring genotypes are phenotypically distinct. However, the 1:2:1 genotypic ratio characteristic of a Mendelian monohybrid cross still applies ( [link] ).
Notification Switch
Would you like to follow the 'Concepts of biology' conversation and receive update notifications?

|
|

|
|

|
|

|
|

|
|

|
|

|
|

|
|
|
|
|

|
|

|