<< Chapter < Page Chapter >> Page >

Populations of species share a gene pool: a collection of all the variants of genes in the species. Again, the basis to any changes in a group or population of organisms must be genetic for this is the only way to share and pass on traits. When variations occur within a species, they can only be passed to the next generation along two main pathways: asexual reproduction or sexual reproduction. The change will be passed on asexually simply if the reproducing cell possesses the changed trait. For the changed trait to be passed on by sexual reproduction, a gamete, such as a sperm or egg cell, must possess the changed trait. In other words, sexually-reproducing organisms can experience several genetic changes in their body cells, but if these changes do not occur in a sperm or egg cell, the changed trait will never reach the next generation. Only heritable traits can evolve. Therefore, reproduction plays a paramount role for genetic change to take root in a population or species. In short, organisms must be able to reproduce with each other to pass new traits to offspring.

Speciation

The biological definition of species, which works for sexually reproducing organisms, is a group of actually or potentially interbreeding individuals. There are exceptions to this rule. Many species are similar enough that hybrid offspring are possible and may often occur in nature, but for the majority of species this rule generally holds. In fact, the presence in nature of hybrids between similar species suggests that they may have descended from a single interbreeding species, and the speciation process may not yet be completed.

Given the extraordinary diversity of life on the planet there must be mechanisms for speciation    : the formation of two species from one original species. Darwin envisioned this process as a branching event and diagrammed the process in the only illustration found in On the Origin of Species ( [link] a ). Compare this illustration to the diagram of elephant evolution ( [link] b ), which shows that as one species changes over time, it branches to form more than one new species, repeatedly, as long as the population survives or until the organism becomes extinct.
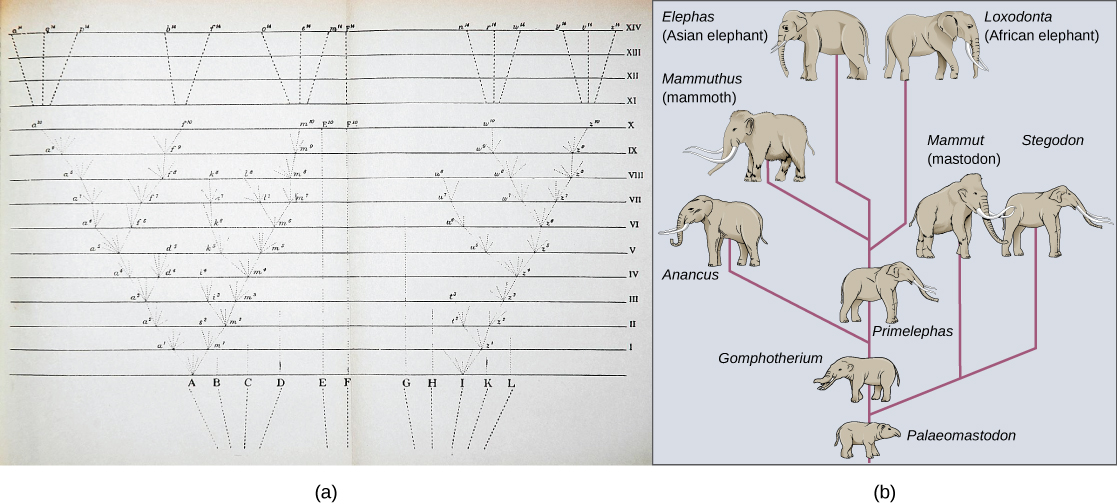
Image (a) shows a sketch of lines branching into a tree shape. At the bottom are 11 vertical lines labeled A through L. These then are branched out as they move up across the page through fourteen rows labeled with Roman numerals. Some branches make a straight line from the bottom row to the top row, others keep branching out further at each row, and some are straight partway through the rows until they connect to an existing branch or form no connection and instead stop. The top four rows each consists of a single line from a branch tip (there are 6 branch tips at row XI) to one of 15 individual final designations. Illustration B shows the evolution of modern African and Asian elephants from a common ancestor, the Palaeomastodon. The Palaeomastodon was similar to modern elephants; however, it was smaller and had a long nose instead of a trunk. Side branches of the elephant evolutionary tree gave rise to mastodons and mammoths. The mammoth is more closely related to modern elephants than the mastodon.
The only illustration in Darwin's On the Origin of Species is (a) a diagram showing speciation events leading to biological diversity. The diagram shows similarities to phylogenetic charts that are drawn today to illustrate the relationships of species. (b) Modern elephants evolved from the Palaeomastodon , a species that lived in Egypt 35–50 million years ago.

For speciation to occur, two new populations must be formed from one original population and they must evolve in such a way that it becomes impossible for individuals from the two new populations to interbreed. Biologists have proposed mechanisms by which this could occur that fall into two broad categories. Allopatric speciation (allo- = "other"; -patric = "homeland") involves geographic separation of populations from a parent species and subsequent evolution. Sympatric speciation (sym- = "same"; -patric = "homeland") involves speciation occurring within a parent species remaining in one location.

Questions & Answers

how do you get the 2/50
Abba Reply
number of sport play by 50 student construct discrete data
Aminu Reply
width of the frangebany leaves on how to write a introduction
Theresa Reply
Solve the mean of variance
Veronica Reply
Step 1: Find the mean. To find the mean, add up all the scores, then divide them by the number of scores. ... Step 2: Find each score's deviation from the mean. ... Step 3: Square each deviation from the mean. ... Step 4: Find the sum of squares. ... Step 5: Divide the sum of squares by n – 1 or N.
kenneth
what is error
Yakuba Reply
Is mistake done to something
Vutshila
Hy
anas
hy
What is the life teble
anas
hy
Jibrin
statistics is the analyzing of data
Tajudeen Reply
what is statics?
Zelalem Reply
how do you calculate mean
Gloria Reply
diveving the sum if all values
Shaynaynay
let A1,A2 and A3 events be independent,show that (A1)^c, (A2)^c and (A3)^c are independent?
Fisaye Reply
what is statistics
Akhisani Reply
data collected all over the world
Shaynaynay
construct a less than and more than table
Imad Reply
The sample of 16 students is taken. The average age in the sample was 22 years with astandard deviation of 6 years. Construct a 95% confidence interval for the age of the population.
Aschalew Reply
Bhartdarshan' is an internet-based travel agency wherein customer can see videos of the cities they plant to visit. The number of hits daily is a normally distributed random variable with a mean of 10,000 and a standard deviation of 2,400 a. what is the probability of getting more than 12,000 hits? b. what is the probability of getting fewer than 9,000 hits?
Akshay Reply
Bhartdarshan'is an internet-based travel agency wherein customer can see videos of the cities they plan to visit. The number of hits daily is a normally distributed random variable with a mean of 10,000 and a standard deviation of 2,400. a. What is the probability of getting more than 12,000 hits
Akshay
1
Bright
Sorry i want to learn more about this question
Bright
Someone help
Bright
a= 0.20233 b=0.3384
Sufiyan
a
Shaynaynay
How do I interpret level of significance?
Mohd Reply
It depends on your business problem or in Machine Learning you could use ROC- AUC cruve to decide the threshold value
Shivam
how skewness and kurtosis are used in statistics
Owen Reply
yes what is it
Taneeya
Got questions? Join the online conversation and get instant answers!
Jobilize.com Reply

Get Jobilize Job Search Mobile App in your pocket Now!

Get it on Google Play Download on the App Store Now


Source:  OpenStax, Biology. OpenStax CNX. Feb 29, 2016 Download for free at http://cnx.org/content/col11448/1.10
Google Play and the Google Play logo are trademarks of Google Inc.

Notification Switch

Would you like to follow the 'Biology' conversation and receive update notifications?

Ask