

| << Chapter < Page | Chapter >> Page > |
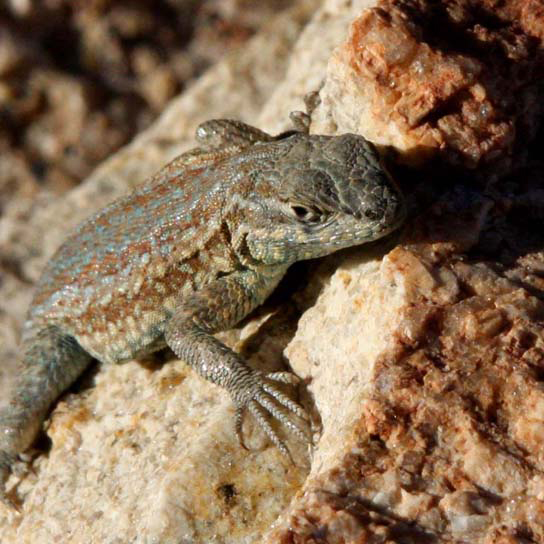
In this scenario, orange males will be favored by natural selection when the population is dominated by blue males, blue males will thrive when the population is mostly yellow males, and yellow males will be selected for when orange males are the most populous. As a result, populations of side-blotched lizards cycle in the distribution of these phenotypes—in one generation, orange might be predominant, and then yellow males will begin to rise in frequency. Once yellow males make up a majority of the population, blue males will be selected for. Finally, when blue males become common, orange males will once again be favored.
Negative frequency-dependent selection serves to increase the population’s genetic variance by selecting for rare phenotypes, whereas positive frequency-dependent selection usually decreases genetic variance by selecting for common phenotypes.
Males and females of certain species are often quite different from one another in ways beyond the reproductive organs. Males are often larger, for example, and display many elaborate colors and adornments, like the peacock’s tail, while females tend to be smaller and duller in decoration. Such differences are known as sexual dimorphisms ( [link] ), which arise from the fact that in many populations, particularly animal populations, there is more variance in the reproductive success of the males than there is of the females. That is, some males—often the bigger, stronger, or more decorated males—get the vast majority of the total matings, while others receive none. This can occur because the males are better at fighting off other males, or because females will choose to mate with the bigger or more decorated males. In either case, this variation in reproductive success generates a strong selection pressure among males to get those matings, resulting in the evolution of bigger body size and elaborate ornaments to get the females’ attention. Females, on the other hand, tend to get a handful of selected matings; therefore, they are more likely to select more desirable males.
Sexual dimorphism varies widely among species, of course, and some species are even sex-role reversed. In such cases, females tend to have a greater variance in their reproductive success than males and are correspondingly selected for the bigger body size and elaborate traits usually characteristic of males.
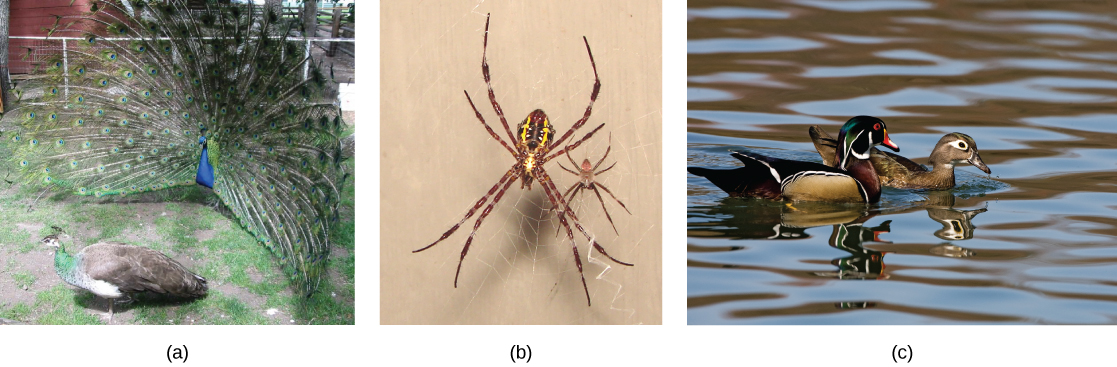
The selection pressures on males and females to obtain matings is known as sexual selection; it can result in the development of secondary sexual characteristics that do not benefit the individual’s likelihood of survival but help to maximize its reproductive success. Sexual selection can be so strong that it selects for traits that are actually detrimental to the individual’s survival. Think, once again, about the peacock’s tail. While it is beautiful and the male with the largest, most colorful tail is more likely to win the female, it is not the most practical appendage. In addition to being more visible to predators, it makes the males slower in their attempted escapes. There is some evidence that this risk, in fact, is why females like the big tails in the first place. The speculation is that large tails carry risk, and only the best males survive that risk: the bigger the tail, the more fit the male. This idea is known as the handicap principle .
Notification Switch
Would you like to follow the 'Biology' conversation and receive update notifications?

|
|
|
|
|

|
|

|
|

|
|

|
|

|
|

|
|

|
|

|
|

|
|

|