<< Chapter < Page Chapter >> Page >

Mendel’s model system

Mendel’s seminal work was accomplished using the garden pea, Pisum sativum , to study inheritance. This species naturally self-fertilizes, such that pollen encounters ova within individual flowers. The flower petals remain sealed tightly until after pollination, preventing pollination from other plants. The result is highly inbred, or “true-breeding,” pea plants. These are plants that always produce offspring that look like the parent. By experimenting with true-breeding pea plants, Mendel avoided the appearance of unexpected traits in offspring that might occur if the plants were not true breeding. The garden pea also grows to maturity within one season, meaning that several generations could be evaluated over a relatively short time. Finally, large quantities of garden peas could be cultivated simultaneously, allowing Mendel to conclude that his results did not come about simply by chance.

Mendelian crosses

Mendel performed hybridizations , which involve mating two true-breeding individuals that have different traits. In the pea, which is naturally self-pollinating, this is done by manually transferring pollen from the anther of a mature pea plant of one variety to the stigma of a separate mature pea plant of the second variety. In plants, pollen carries the male gametes (sperm) to the stigma, a sticky organ that traps pollen and allows the sperm to move down the pistil to the female gametes (ova) below. To prevent the pea plant that was receiving pollen from self-fertilizing and confounding his results, Mendel painstakingly removed all of the anthers from the plant’s flowers before they had a chance to mature.

Plants used in first-generation crosses were called P 0    , or parental generation one, plants ( [link] ). Mendel collected the seeds belonging to the P 0 plants that resulted from each cross and grew them the following season. These offspring were called the F 1    , or the first filial ( filial = offspring, daughter or son), generation. Once Mendel examined the characteristics in the F 1 generation of plants, he allowed them to self-fertilize naturally. He then collected and grew the seeds from the F 1 plants to produce the F 2    , or second filial, generation. Mendel’s experiments extended beyond the F 2 generation to the F 3 and F 4 generations, and so on, but it was the ratio of characteristics in the P 0 −F 1 −F 2 generations that were the most intriguing and became the basis for Mendel’s postulates.

The diagram shows a cross between pea plants that are true-breeding for purple flower color and plants true-breeding for white flower color. This cross-fertilization of the P generation resulted in an F_{1} generation with all violet flowers. Self-fertilization of the F_{1} generation resulted in an F_{2} generation that consisted of 705 plants with violet flowers, and 224 plants with white flowers.
In one of his experiments on inheritance patterns, Mendel crossed plants that were true-breeding for violet flower color with plants true-breeding for white flower color (the P generation). The resulting hybrids in the F 1 generation all had violet flowers. In the F 2 generation, approximately three quarters of the plants had violet flowers, and one quarter had white flowers.

Garden pea characteristics revealed the basics of heredity

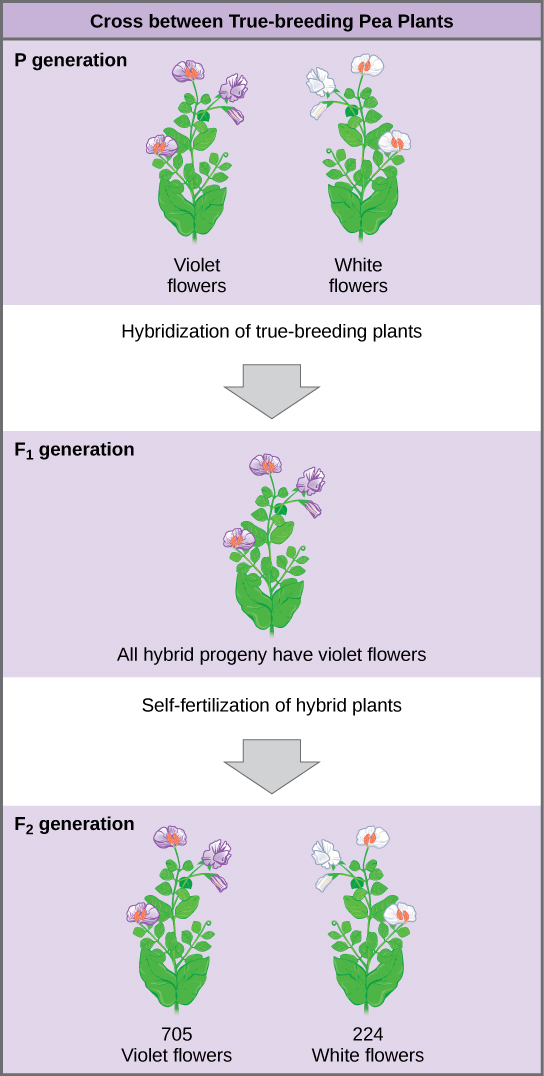
In his 1865 publication, Mendel reported the results of his crosses involving seven different characteristics, each with two contrasting traits. A trait    is defined as a variation in the physical appearance of a heritable characteristic. The characteristics included plant height, seed texture, seed color, flower color, pea pod size, pea pod color, and flower position. For the characteristic of flower color, for example, the two contrasting traits were white versus violet. To fully examine each characteristic, Mendel generated large numbers of F 1 and F 2 plants, reporting results from 19,959 F 2 plants alone. His findings were consistent.

Questions & Answers

how do you get the 2/50
Abba Reply
number of sport play by 50 student construct discrete data
Aminu Reply
width of the frangebany leaves on how to write a introduction
Theresa Reply
Solve the mean of variance
Veronica Reply
Step 1: Find the mean. To find the mean, add up all the scores, then divide them by the number of scores. ... Step 2: Find each score's deviation from the mean. ... Step 3: Square each deviation from the mean. ... Step 4: Find the sum of squares. ... Step 5: Divide the sum of squares by n – 1 or N.
kenneth
what is error
Yakuba Reply
Is mistake done to something
Vutshila
Hy
anas
hy
What is the life teble
anas
hy
Jibrin
statistics is the analyzing of data
Tajudeen Reply
what is statics?
Zelalem Reply
how do you calculate mean
Gloria Reply
diveving the sum if all values
Shaynaynay
let A1,A2 and A3 events be independent,show that (A1)^c, (A2)^c and (A3)^c are independent?
Fisaye Reply
what is statistics
Akhisani Reply
data collected all over the world
Shaynaynay
construct a less than and more than table
Imad Reply
The sample of 16 students is taken. The average age in the sample was 22 years with astandard deviation of 6 years. Construct a 95% confidence interval for the age of the population.
Aschalew Reply
Bhartdarshan' is an internet-based travel agency wherein customer can see videos of the cities they plant to visit. The number of hits daily is a normally distributed random variable with a mean of 10,000 and a standard deviation of 2,400 a. what is the probability of getting more than 12,000 hits? b. what is the probability of getting fewer than 9,000 hits?
Akshay Reply
Bhartdarshan'is an internet-based travel agency wherein customer can see videos of the cities they plan to visit. The number of hits daily is a normally distributed random variable with a mean of 10,000 and a standard deviation of 2,400. a. What is the probability of getting more than 12,000 hits
Akshay
1
Bright
Sorry i want to learn more about this question
Bright
Someone help
Bright
a= 0.20233 b=0.3384
Sufiyan
a
Shaynaynay
How do I interpret level of significance?
Mohd Reply
It depends on your business problem or in Machine Learning you could use ROC- AUC cruve to decide the threshold value
Shivam
how skewness and kurtosis are used in statistics
Owen Reply
yes what is it
Taneeya
Got questions? Join the online conversation and get instant answers!
Jobilize.com Reply

Get Jobilize Job Search Mobile App in your pocket Now!

Get it on Google Play Download on the App Store Now


Source:  OpenStax, Biology. OpenStax CNX. Feb 29, 2016 Download for free at http://cnx.org/content/col11448/1.10
Google Play and the Google Play logo are trademarks of Google Inc.

Notification Switch

Would you like to follow the 'Biology' conversation and receive update notifications?

Ask