

| << Chapter < Page | Chapter >> Page > |
Notice that when N is very small, ( K-N )/ K becomes close to K/K or 1, and the right side of the equation reduces to r max N , which means the population is growing exponentially and is not influenced by carrying capacity. On the other hand, when N is large, ( K-N )/ K come close to zero, which means that population growth will be slowed greatly or even stopped. Thus, population growth is greatly slowed in large populations by the carrying capacity K . This model also allows for the population of a negative population growth, or a population decline. This occurs when the number of individuals in the population exceeds the carrying capacity (because the value of (K-N)/K is negative).
A graph of this equation yields an S-shaped curve ( [link] ), and it is a more realistic model of population growth than exponential growth. There are three different sections to an S-shaped curve. Initially, growth is exponential because there are few individuals and ample resources available. Then, as resources begin to become limited, the growth rate decreases. Finally, growth levels off at the carrying capacity of the environment, with little change in population size over time.
The logistic model assumes that every individual within a population will have equal access to resources and, thus, an equal chance for survival. For plants, the amount of water, sunlight, nutrients, and the space to grow are the important resources, whereas in animals, important resources include food, water, shelter, nesting space, and mates.
In the real world, phenotypic variation among individuals within a population means that some individuals will be better adapted to their environment than others. The resulting competition between population members of the same species for resources is termed intraspecific competition (intra- = “within”; -specific = “species”). Intraspecific competition for resources may not affect populations that are well below their carrying capacity—resources are plentiful and all individuals can obtain what they need. However, as population size increases, this competition intensifies. In addition, the accumulation of waste products can reduce an environment’s carrying capacity.
Yeast, a microscopic fungus used to make bread and alcoholic beverages, exhibits the classical S-shaped curve when grown in a test tube ( [link] a ). Its growth levels off as the population depletes the nutrients that are necessary for its growth. In the real world, however, there are variations to this idealized curve. Examples in wild populations include sheep and harbor seals ( [link] b ). In both examples, the population size exceeds the carrying capacity for short periods of time and then falls below the carrying capacity afterwards. This fluctuation in population size continues to occur as the population oscillates around its carrying capacity. Still, even with this oscillation, the logistic model is confirmed.
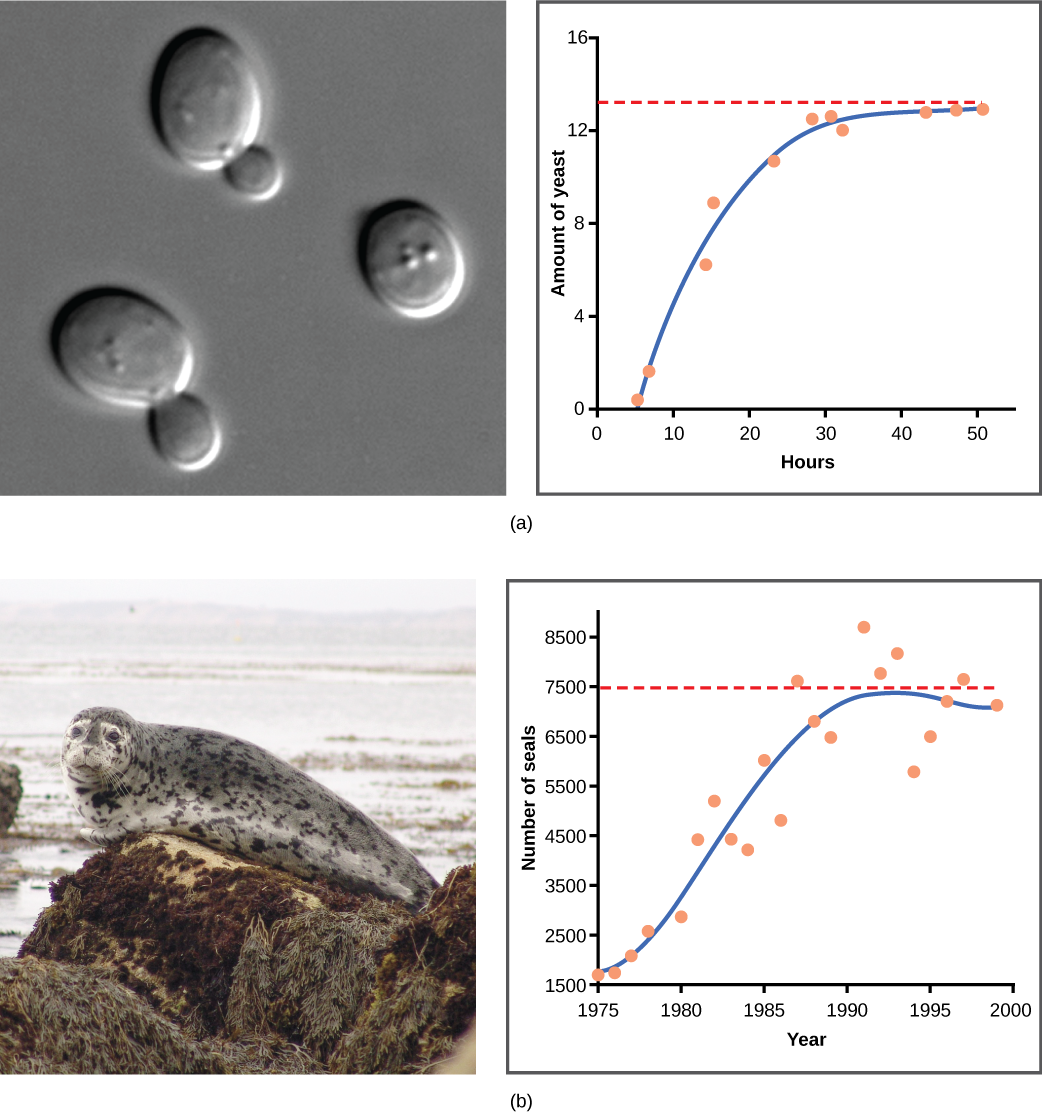
If the major food source of the seals declines due to pollution or overfishing, which of the following would likely occur?
Populations with unlimited resources grow exponentially, with an accelerating growth rate. When resources become limiting, populations follow a logistic growth curve. The population of a species will level off at the carrying capacity of its environment.
[link] b If the major food source of the seals declines due to pollution or overfishing, which of the following would likely occur?
[link] b A
Notification Switch
Would you like to follow the 'Biology' conversation and receive update notifications?

|
|
|
|
|
|
|

|
|

|
|

|
|

|
|

|
|

|
|

|
|

|
|

|