<< Chapter < Page Chapter >> Page >

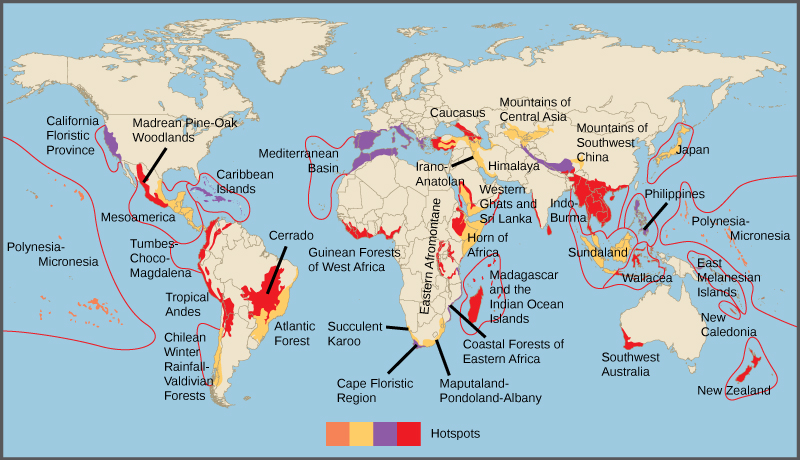
Regardless of the mechanisms, it is certainly true that all levels of biodiversity are greatest in the tropics. Additionally, the rate of endemism is highest, and there are more biodiversity hotspots. However, this richness of diversity also means that knowledge of species is lowest, and there is a high potential for biodiversity loss.

Conservation of biodiversity

In 1988, British environmentalist Norman Myers developed a conservation concept to identify areas rich in species and at significant risk for species loss: biodiversity hotspots. Biodiversity hotspots are geographical areas that contain high numbers of endemic species. The purpose of the concept was to identify important locations on the planet for conservation efforts, a kind of conservation triage. By protecting hotspots, governments are able to protect a larger number of species. The original criteria for a hotspot included the presence of 1500 or more endemic plant species and 70 percent of the area disturbed by human activity. There are now 34 biodiversity hotspots ( [link] ) containing large numbers of endemic species, which include half of Earth’s endemic plants.

 Biodiversity hotspots are indicated on a world map. Most hotspots occur in coastal regions and on islands.
Conservation International has identified 34 biodiversity hotspots, which cover only 2.3 percent of the Earth’s surface but have endemic to them 42 percent of the terrestrial vertebrate species and 50 percent of the world’s plants.

Biodiversity change through geological time

The number of species on the planet, or in any geographical area, is the result of an equilibrium of two evolutionary processes that are ongoing: speciation and extinction. Both are natural “birth” and “death” processes of macroevolution. When speciation rates begin to outstrip extinction rates, the number of species will increase; likewise, the number of species will decrease when extinction rates begin to overtake speciation rates. Throughout Earth’s history, these two processes have fluctuated—sometimes leading to dramatic changes in the number of species on Earth as reflected in the fossil record ( [link] ).

The graph plots percent extinction occurrences versus time in millions of years before present time, starting 550 million years ago. Extinction occurrences increase and decrease in a cyclical manner. At the lowest points on the cycle, extinction occurrences were between 2% and 5% percent. Spikes in the number of extinctions occurred at the end of geological periods: end-Ordovician, 450 million years ago; end-Devonian, 374 million years ago; end-Permian, 252 million years ago; end-Triassic, 200 million years ago; and end-Cretaceous, 65 million years ago. During these spikes, extinction occurrences approximately ranged from 22% to 50%.
Percent extinction occurrences as reflected in the fossil record have fluctuated throughout Earth’s history. Sudden and dramatic losses of biodiversity, called mass extinctions, have occurred five times.

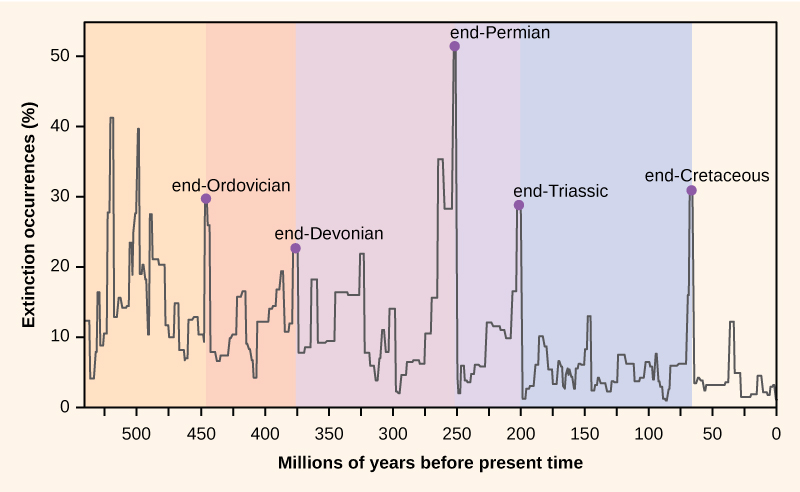
Paleontologists have identified five strata in the fossil record that appear to show sudden and dramatic (greater than half of all extant species disappearing from the fossil record) losses in biodiversity. These are called mass extinctions. There are many lesser, yet still dramatic, extinction events, but the five mass extinctions have attracted the most research. An argument can be made that the five mass extinctions are only the five most extreme events in a continuous series of large extinction events throughout the Phanerozoic (since 542 million years ago). In most cases, the hypothesized causes are still controversial; however, the most recent event seems clear.

The five mass extinctions

The fossil record of the mass extinctions was the basis for defining periods of geological history, so they typically occur at the transition point between geological periods. The transition in fossils from one period to another reflects the dramatic loss of species and the gradual origin of new species. These transitions can be seen in the rock strata. [link] provides data on the five mass extinctions.

Questions & Answers

how do you get the 2/50
Abba Reply
number of sport play by 50 student construct discrete data
Aminu Reply
width of the frangebany leaves on how to write a introduction
Theresa Reply
Solve the mean of variance
Veronica Reply
Step 1: Find the mean. To find the mean, add up all the scores, then divide them by the number of scores. ... Step 2: Find each score's deviation from the mean. ... Step 3: Square each deviation from the mean. ... Step 4: Find the sum of squares. ... Step 5: Divide the sum of squares by n – 1 or N.
kenneth
what is error
Yakuba Reply
Is mistake done to something
Vutshila
Hy
anas
hy
What is the life teble
anas
hy
Jibrin
statistics is the analyzing of data
Tajudeen Reply
what is statics?
Zelalem Reply
how do you calculate mean
Gloria Reply
diveving the sum if all values
Shaynaynay
let A1,A2 and A3 events be independent,show that (A1)^c, (A2)^c and (A3)^c are independent?
Fisaye Reply
what is statistics
Akhisani Reply
data collected all over the world
Shaynaynay
construct a less than and more than table
Imad Reply
The sample of 16 students is taken. The average age in the sample was 22 years with astandard deviation of 6 years. Construct a 95% confidence interval for the age of the population.
Aschalew Reply
Bhartdarshan' is an internet-based travel agency wherein customer can see videos of the cities they plant to visit. The number of hits daily is a normally distributed random variable with a mean of 10,000 and a standard deviation of 2,400 a. what is the probability of getting more than 12,000 hits? b. what is the probability of getting fewer than 9,000 hits?
Akshay Reply
Bhartdarshan'is an internet-based travel agency wherein customer can see videos of the cities they plan to visit. The number of hits daily is a normally distributed random variable with a mean of 10,000 and a standard deviation of 2,400. a. What is the probability of getting more than 12,000 hits
Akshay
1
Bright
Sorry i want to learn more about this question
Bright
Someone help
Bright
a= 0.20233 b=0.3384
Sufiyan
a
Shaynaynay
How do I interpret level of significance?
Mohd Reply
It depends on your business problem or in Machine Learning you could use ROC- AUC cruve to decide the threshold value
Shivam
how skewness and kurtosis are used in statistics
Owen Reply
yes what is it
Taneeya
Got questions? Join the online conversation and get instant answers!
Jobilize.com Reply

Get Jobilize Job Search Mobile App in your pocket Now!

Get it on Google Play Download on the App Store Now


Source:  OpenStax, Biology. OpenStax CNX. Feb 29, 2016 Download for free at http://cnx.org/content/col11448/1.10
Google Play and the Google Play logo are trademarks of Google Inc.

Notification Switch

Would you like to follow the 'Biology' conversation and receive update notifications?

Ask