<< Chapter < Page Chapter >> Page >
By the end of this section, you will be able to:
  • Identify new technologies for describing biodiversity
  • Explain the legislative framework for conservation
  • Describe principles and challenges of conservation preserve design
  • Identify examples of the effects of habitat restoration
  • Discuss the role of zoos in biodiversity conservation

Preserving biodiversity is an extraordinary challenge that must be met by greater understanding of biodiversity itself, changes in human behavior and beliefs, and various preservation strategies.

Measuring biodiversity

The technology of molecular genetics and data processing and storage are maturing to the point where cataloguing the planet’s species in an accessible way is close to feasible. DNA barcoding    is one molecular genetic method, which takes advantage of rapid evolution in a mitochondrial gene present in eukaryotes, excepting the plants, to identify species using the sequence of portions of the gene. Plants may be barcoded using a combination of chloroplast genes. Rapid mass sequencing machines make the molecular genetics portion of the work relatively inexpensive and quick. Computer resources store and make available the large volumes of data. Projects are currently underway to use DNA barcoding to catalog museum specimens, which have already been named and studied, as well as testing the method on less studied groups. As of mid 2012, close to 150,000 named species had been barcoded. Early studies suggest there are significant numbers of undescribed species that looked too much like sibling species to previously be recognized as different. These now can be identified with DNA barcoding.

Numerous computer databases now provide information about named species and a framework for adding new species. However, as already noted, at the present rate of description of new species, it will take close to 500 years before the complete catalog of life is known. Many, perhaps most, species on the planet do not have that much time.

There is also the problem of understanding which species known to science are threatened and to what degree they are threatened. This task is carried out by the non-profit IUCN which, as previously mentioned, maintains the Red List—an online listing of endangered species categorized by taxonomy, type of threat, and other criteria ( [link] ). The Red List is supported by scientific research. In 2011, the list contained 61,000 species, all with supporting documentation.

Art connection

 Bar graph shows the percentage of animal species, by group, that are critically endangered, endangered, or vulnerable. Approximately 21% of mammal species are on the IUCN Red List. Of these, about 10% are vulnerable, 7% are endangered, and 4% are critically endangered. Approximately 12% of bird species are on the Red List. Of these, about 6% are vulnerable, 4% are endangered, and 2% are critically endangered. Approximately 6% of reptile species are on the Red List. Of these, about 3% are vulnerable, 2% are endangered, and 1% is critically endangered. Approximately 29% of amphibian species are on the Red List. Of these, about 10% are vulnerable, 12% are endangered, and 7% are critically endangered. Approximately 4% of fish species are on the Red List. Of these, about 2% are vulnerable, 1% is endangered, and 1% is critically endangered. No insect species fall on the Red List. Approximately 1.5% of mollusk species are on the Red List. Of these, about 1% is vulnerable, and 0.25% each are endangered or critically endangered. Approximately 3% of plant species are on the Red List. Of these, about 2% are vulnerable, .5% each are endangered or critically endangered.
This chart shows the percentage of various animal species, by group, on the IUCN Red List as of 2007.

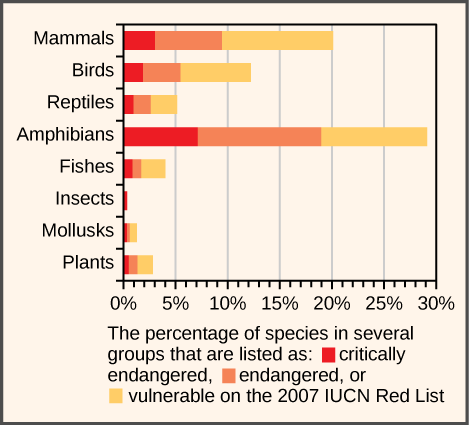
Which of the following statements is not supported by this graph?

  1. There are more vulnerable fishes than critically endangered and endangered fishes combined.
  2. There are more critically endangered amphibians than vulnerable, endangered and critically endangered reptiles combined.
  3. Within each group, there are more critically endangered species than vulnerable species.
  4. A greater percentage of bird species are critically endangered than mollusk species.

Questions & Answers

Ayele, K., 2003. Introductory Economics, 3rd ed., Addis Ababa.
Widad Reply
can you send the book attached ?
Ariel
?
Ariel
What is economics
Widad Reply
the study of how humans make choices under conditions of scarcity
AI-Robot
U(x,y) = (x×y)1/2 find mu of x for y
Desalegn Reply
U(x,y) = (x×y)1/2 find mu of x for y
Desalegn
what is ecnomics
Jan Reply
this is the study of how the society manages it's scarce resources
Belonwu
what is macroeconomic
John Reply
macroeconomic is the branch of economics which studies actions, scale, activities and behaviour of the aggregate economy as a whole.
husaini
etc
husaini
difference between firm and industry
husaini Reply
what's the difference between a firm and an industry
Abdul
firm is the unit which transform inputs to output where as industry contain combination of firms with similar production 😅😅
Abdulraufu
Suppose the demand function that a firm faces shifted from Qd  120 3P to Qd  90  3P and the supply function has shifted from QS  20  2P to QS 10  2P . a) Find the effect of this change on price and quantity. b) Which of the changes in demand and supply is higher?
Toofiq Reply
explain standard reason why economic is a science
innocent Reply
factors influencing supply
Petrus Reply
what is economic.
Milan Reply
scares means__________________ends resources. unlimited
Jan
economics is a science that studies human behaviour as a relationship b/w ends and scares means which have alternative uses
Jan
calculate the profit maximizing for demand and supply
Zarshad Reply
Why qualify 28 supplies
Milan
what are explicit costs
Nomsa Reply
out-of-pocket costs for a firm, for example, payments for wages and salaries, rent, or materials
AI-Robot
concepts of supply in microeconomics
David Reply
economic overview notes
Amahle Reply
identify a demand and a supply curve
Salome Reply
i don't know
Parul
there's a difference
Aryan
Demand curve shows that how supply and others conditions affect on demand of a particular thing and what percent demand increase whith increase of supply of goods
Israr
Hi Sir please how do u calculate Cross elastic demand and income elastic demand?
Abari
Got questions? Join the online conversation and get instant answers!
Jobilize.com Reply

Get Jobilize Job Search Mobile App in your pocket Now!

Get it on Google Play Download on the App Store Now


Source:  OpenStax, Biology. OpenStax CNX. Feb 29, 2016 Download for free at http://cnx.org/content/col11448/1.10
Google Play and the Google Play logo are trademarks of Google Inc.

Notification Switch

Would you like to follow the 'Biology' conversation and receive update notifications?

Ask